
Before and After: How Workplace Redesign Turned a Half-Empty Office Into a Team Destination
A composite Boston-area office moved daily attendance from about 35% to 65% by redesigning space around how people actually work, not by tightening attendance rules. The data-driven redesign also cut at-risk annual rent by $120,000. Office Gallery breaks down the audit, the changes, and the results.
Post Summary
A 30-day space audit combining badge data, room-booking records, and direct observation found that desk use stayed below 40% on most days, giving leadership a clearer picture than employee surveys alone could provide. Meeting rooms showed the same pattern from a different angle: rooms sized for large groups were consistently booked but used by only two or three people, which blocked other teams from getting the space they actually needed. Employee feedback pointed to the same root causes, citing noise, weak privacy, and a lack of any real quiet option for focused work. Attendance itself was inconsistent, spiking on a handful of days and dropping off sharply on others. Taken together, the data showed a workplace built around solo desk work being used by people who mostly needed to collaborate, focus, or meet, which framed the redesign as a functional problem rather than a culture problem.
Once leadership had the audit data, the guiding question changed from why people should come in to what the office should actually be for. In a hybrid model, the office's role was not solo desk work, since that could happen anywhere, but collaboration, mentoring, client meetings, and project work, the tasks that are genuinely harder to do well from home. That reframing shaped every design decision that followed. Instead of starting from a floor plan template or a desk-per-employee ratio, the redesign started from the specific activities the data showed people needed space for, then sized and placed rooms to match. Desk count was set at about 0.65 per employee based on measured peak demand rather than a legacy one-desk-per-person assumption, and oversized conference rooms were resized around how meetings actually happened rather than how they were originally planned.
The physical redesign converted long rows of assigned desks into a mix of team neighborhoods, quiet zones, and shared workstations sized to actual peak demand. Oversized conference rooms were split into smaller huddle rooms and private phone booths, and each meeting space was equipped with hybrid meeting tools, including wide-angle cameras, table-wide audio pickup, and easy-to-reach power, so remote participants could take part fully rather than being an afterthought. A central café gave people a place to connect between meetings instead of retreating straight back to a desk. Acoustic treatment tied the whole layout together, using fabric-wrapped panels, ceiling baffles, and sound masking to separate louder collaboration areas from quiet ones. Shared workstations were upgraded with height-adjustable sit-to-stand desks, fully adjustable ergonomic chairs, monitor arms, and integrated power and data access, making them easy for any hybrid employee to use on arrival.
Average daily attendance rose from about 35% to about 65% after the redesign, and the improvement extended beyond a single headline number. The weekly attendance pattern became noticeably more even, replacing a sharp midweek spike and thin Mondays and Fridays with steadier use across the week. Meeting room availability improved as well, since right-sized huddle rooms replaced the oversized boardrooms that had been booked but sitting mostly empty, cutting down on the wasted reservations that had previously blocked access. Employees also reported more spontaneous, in-person collaboration once team neighborhoods and social space replaced uniform desk rows. Because these are composite, representative figures rather than a single client's reported results, they're best read as a realistic illustration of what a data-driven redesign of this kind can achieve rather than a guaranteed outcome.
Space utilization has a direct rent cost, and this example makes that cost concrete. On a 10,000-square-foot office priced at about $40 per square foot, running at 35% utilization put roughly $260,000 in annual rent at risk on space that was not being effectively used. Once utilization rose to about 65% after the redesign, that at-risk figure dropped to roughly $140,000, a swing of about $120,000 a year. That number reframes a workplace redesign from a discretionary comfort upgrade into a lease-economics decision, since underused square footage carries a real, quantifiable carrying cost whether or not anyone is sitting in it. For organizations evaluating a redesign against a lease renewal, that framing gives finance and facilities a shared number to plan around rather than competing, qualitative arguments about comfort versus cost.
A Boston office went from about 35% daily attendance to about 65% by changing how space was used, not by pushing stricter office rules.
Our takeaway is this: if your office is half-empty, the problem may not be hybrid work itself. It may be that the space still fits desk work, even though people now come in for team work, private calls, focus time, and face-to-face time. In this case, the fix was simple in concept: cut desk-heavy layouts, add smaller meeting rooms, build quiet spots, improve acoustics, and make shared workstations easier to use.
Key points:
- Attendance was low: fewer than 40% of employees were in the office on a normal day.
- The layout was a poor fit: too much noise, weak privacy, oversized meeting rooms, and almost no quiet space.
- The team used data first: badge swipes, room bookings, and a 30-day space audit showed what people were doing.
- The redesign changed the mix: fewer assigned desks, more huddle rooms, phone booths, quiet pods, team zones, and a central café.
- The result: attendance moved from about 35% to 65%, and space waste dropped.
- The cost angle matters: in a 10,000-square-foot office at about $40 per square foot, underused space can put about $260,000 in annual rent at risk; at 65% use, that drops to about $140,000.
Takeaway: if you want people to commute in, the office has to give them something home does not.
The office did better once it stopped being a place people were told to go and became a place that helped them do the work they came in to do.

Before: What the Organization Found in Its Existing Space
Low attendance, uneven use, and disconnected teams
Assigned desks sat in long rows, but many stayed empty most days. And when people did come in, the office still didn’t work well for hybrid work.
Attendance wasn’t steady either. It jumped on a few days, then dropped off hard on others, with almost no middle ground. Small teams ended up taking over large conference rooms because there wasn’t a better option. At the same time, people who needed to concentrate had to work through noise and constant interruptions, with no quiet place to go.
What the data and employee feedback showed
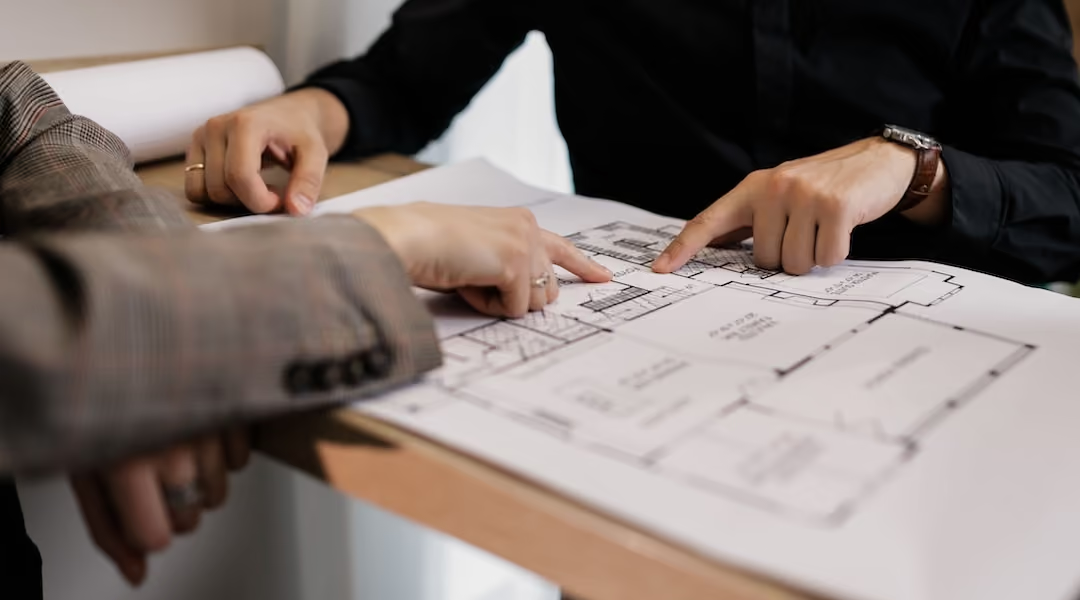
Leadership needed a clearer view of what was happening, so it looked at how the office was actually being used. A 30-day space audit pulled together badge data, room-booking software, and direct observation. That gave leaders a much better read than a survey alone[2].
Desk use often stayed below 40%[2]. Meeting rooms showed the same issue again and again: rooms were booked for big groups, but only two or three people showed up. Those unused reservations kept other people from getting access to the space they needed[2].
Employees pointed to the same pain points: noise, weak privacy, and poor support for focused work. As Mike Troia, CEO of Office Gallery, put it:
"When you have the data in front of you, the conversation shifts from opinions to facts. You can clearly see how people are using the space, and that gives you the confidence to make changes." [2]
The pattern was hard to miss. Across each type of space, the office setup didn’t match how people were working.
Before-space conditions and their impact: comparison table
Those findings set up the redesign strategy that came next.
The Redesign Strategy: Building an Office Around Purpose, Not Presence
Defining the office's role in a hybrid model
The audit made the design brief pretty clear. After leadership reviewed the findings, the question changed. Instead of asking, "Why should people come in?" they started with a more useful one: What should the office be for?
In a hybrid model, the answer wasn't solo desk work. People came in for collaboration, mentoring, client meetings, and project work - the kinds of tasks that are harder to do well from home. So the redesign focused on those moments. That purpose-first brief shaped each design decision.
Space planning changes that matched real work patterns
The data pointed in one direction. Desk use was low, open areas were noisy, and many conference rooms were too big for how people used them. So the space plan shifted away from long rows of assigned desks and toward a mix of settings that matched day-to-day work.
Uniform desk rows were replaced with zones for teamwork, quiet work, and informal connection. Desk count dropped to about 0.65 per employee [2], based on actual peak demand instead of a one-desk-per-person model that no longer fit the way people used the office.
Oversized conference rooms were split into smaller huddle rooms and private focus pods. Acoustic planning helped separate heads-down work from group activity. Each meeting room also included hybrid meeting tools - wide-angle cameras, table-wide audio pickup, and easy-to-reach power - so remote participants could take part fully [3][4].
Those decisions set up the physical changes that came next.
How Office Gallery supports this process
Office Gallery turned that brief into layout plans, furniture choices, and installation support, with quick-turn product options for tight timelines [5][6][7].
After: The Physical Changes That Made the Office Worth Coming Back To
Collaboration zones, quiet rooms, and social spaces that changed behavior
Those planning choices turned into a floor plan built for hybrid work. Every square foot had a job to do. The open office became a set of team neighborhoods, which made spur-of-the-moment conversations easier and more natural.
The point wasn’t to squeeze in more desks. It was to give people better reasons to show up.
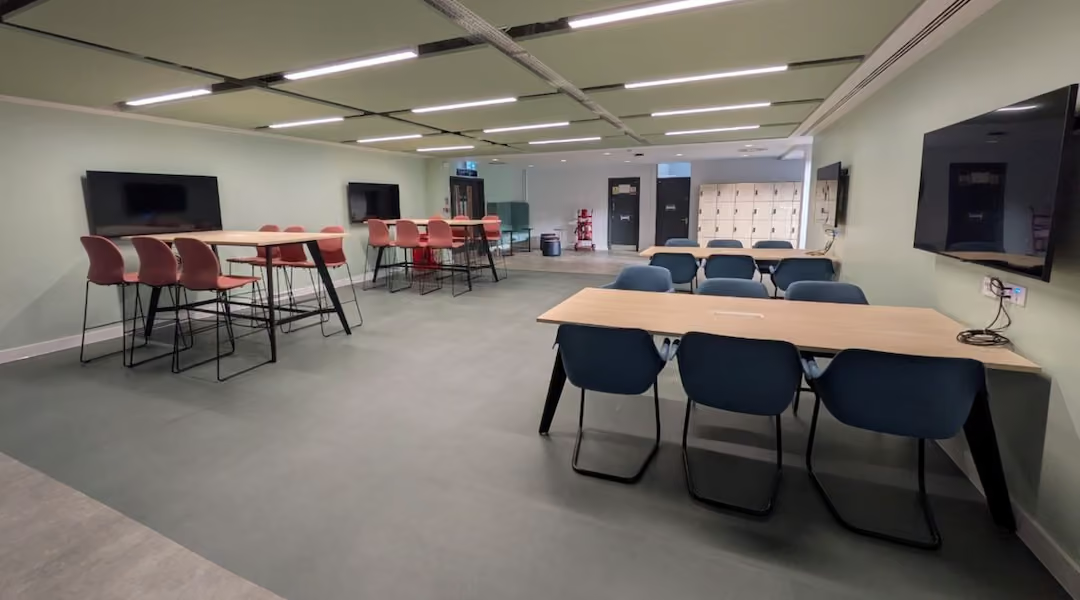
Large conference rooms that sat half-empty were turned into smaller huddle rooms and private phone booths. A central café created a spot where people could connect between meetings instead of rushing back to a desk. Acoustic treatments helped the whole layout work as one system. Fabric-wrapped panels, ceiling baffles, and sound masking separated busy areas from quiet ones, so people could focus without losing the energy of a shared office.
Shared workstations and ergonomic upgrades for hybrid use
Shared workstations took the place of assigned desks, and each one was set up for hybrid use. Instead of fixed-height desks and standard task chairs, every workstation included a height-adjustable sit-to-stand desk, a fully adjustable ergonomic chair, monitor arms, and integrated power and data access - easy for hybrid employees to use [6].
Those physical updates laid the groundwork for the attendance and utilization gains that came next.
Before-and-after space mix and workstation features: comparison tables
Results and Takeaways: Attendance Gains, Better Utilization, and Lessons for Boston Workplaces
Measured improvements in attendance and engagement
The redesign changed behavior, not just appearance. In this composite Boston-area example, average daily attendance climbed from about 35% to about 65%. The weekly pattern also became more even, with fewer empty reservations and less wasted space.
The money side looked better too. At 35% utilization, a 10,000-square-foot office at $40 per square foot puts about $260,000 in annual rent at risk. At 65%, that drops to about $140,000. That's a $120,000 swing [2].
Key before-and-after business metrics: comparison table
Note: Figures below are representative for this composite Boston-area professional services example and are intended to illustrate realistic outcomes, not report a single client's results.
The clearest changes showed up in attendance, room use, and week-to-week consistency.
What Boston-area leaders should take from this example
For Boston-area leaders, the main point is straightforward: start with the business problem, not the furniture.
Before anyone picks finishes or sketches a floor plan, leadership needs to name what the office is failing to do. Is collaboration weak? Is the commute hard to justify? Is too much rent going toward space people barely use? That clarity shapes better choices from the start.
Occupancy and booking data should come first. It cuts out guesswork around desk ratios, zoning, and acoustics. Instead of saying, "We think people need more meeting rooms", teams can look at the numbers and see what is and isn't being used.
Just as important, the attendance gain came from design choices, not pressure. People showed up more often because the office worked better for them. It gave them a better reason to come in, and that led to better attendance without leaning harder on return-to-office rules.
Office Design with Hybrid in Mind | Insightrix Research
FAQs
How do you know if low attendance is a space problem?
Low attendance often comes down to design, not just company culture. If you want to know whether space is part of the problem, don’t stop at badge-swipe data. Look at space utilization too.
Compare booking logs with sensor data. That’s how you spot rooms that are reserved but sit empty, areas that are packed, and zones that barely get used.
If people can’t find quiet places to focus, have a hard time running hybrid meetings, or keep getting distracted by noise, your layout probably isn’t matching the way they work day to day.
What data should leaders review before redesigning an office?
Before redesigning an office, leaders should start with a 30-day space-use audit based on how people actually work, not what anyone assumes they do. The goal is simple: compare space use with occupancy data so you can see how often desks, rooms, and shared zones are actually in use.
It also helps to look at a few data points side by side:
- booking logs versus sensor data
- peak use versus average use
- informal employee surveys about focus work, training, and collaboration needs
That mix gives a clearer picture of what’s going on day to day. A meeting room may look busy in the booking system but sit empty half the time. A desk area may seem full on Tuesday mornings and quiet the rest of the week. Small details like that matter.
When you put those findings together, it becomes much easier to measure underused space and make smarter calls on lease terms and office layout.
How long does a workplace redesign like this usually take?
The timeline depends on how much change the project involves. In many cases, it starts with a 30-day utilization audit so the team can make decisions based on actual usage, not guesswork.
If the redesign is connected to a lease renewal, that utilization data should be gathered and reviewed 12 to 18 months before the lease ends. From there, the full process usually moves through needs assessment, space planning, and final installation, with the work scheduled to keep business disruption as low as possible.
•••••
The right workplace design measurably improves employee performance, satisfaction, and retention. Office Gallery partners with businesses on that strategy, and welcomes architects and interior designers looking for a furniture and space-planning partner on their own projects. Contact the team at 781-762-3733, email info@officegallery.net, or visit the showroom at 151 Carnegie Row in Norwood.
Key Points
What does the audit methodology reveal about diagnosing a low-attendance office correctly?
- A 30-day audit combined badge swipes, room-booking data, and direct observation rather than relying on a single data source -- triangulating three data types closes the blind spots any one method leaves, such as a booking system that shows a room as used when it was reserved but empty [2]
- Desk use stayed below 40% across the audit period -- a figure this low, sustained over a full month, rules out a temporary dip and confirms a structural mismatch between desk supply and actual demand [2]
- Meeting rooms were consistently booked for large groups but used by two or three people -- this specific failure mode shows the problem was room sizing, not room quantity, which points capital toward right-sizing rather than simply adding more space [2]
- Employee feedback on noise, privacy, and focus problems matched what the occupancy data showed independently -- agreement between quantitative data and qualitative feedback removes the risk of a redesign built on one flawed signal
- CEO Mike Troia noted that data shifts the conversation from opinions to facts -- this reframes the audit's value as organizational rather than purely technical, since it changes how a leadership team is able to agree on what to fix [2]
- The audit was run before any design decisions were made, not layered on afterward to justify a plan -- sequencing data collection first is what keeps the resulting redesign tied to actual usage rather than to a preexisting design preference
What does the shift from "why come in" to "what is the office for" reveal about redesign strategy?
- Leadership reframed the core question from why people should come in to what the office should be for -- this shift moves the burden from persuading employees to justifying the space itself, which is a more solvable design problem
- The office's role was defined around collaboration, mentoring, client meetings, and project work rather than solo desk work -- naming the specific activities the office needed to support turned an abstract goal into a concrete design brief
- Desk count was set at about 0.65 per employee based on measured peak demand -- basing a ratio on actual peak use rather than a legacy one-desk-per-person assumption avoids both overbuilding and underbuilding desk supply [2]
- Oversized conference rooms were resized around how meetings actually happened, not how they were originally planned -- this corrects the specific mismatch the audit identified, rather than applying a generic room-count formula
- Hybrid meeting tools, including wide-angle cameras, table-wide audio, and accessible power, were built into every meeting space from the start -- treating hybrid participants as a baseline requirement rather than an add-on avoids the common failure mode of retrofitting rooms after complaints surface [3] [4]
- The purpose-first brief shaped every subsequent design decision rather than being a one-time planning exercise -- keeping the original brief as the ongoing reference point is what kept later furniture and layout choices consistent with the original diagnosis
What does the physical redesign reveal about turning underused square footage into space people choose to use?
- Long rows of assigned desks were replaced with team neighborhoods, quiet zones, and shared workstations -- zoning by activity type rather than by department is what let the same total square footage serve more distinct kinds of work
- Oversized boardrooms were split into smaller huddle rooms and private phone booths -- converting existing square footage into right-sized rooms increased usable meeting capacity without adding to the building's footprint
- A central café gave people a reason to stay on-site between meetings instead of returning straight to a desk -- this specifically targets the kind of informal, unplanned interaction that a purely desk-and-meeting-room layout cannot generate on its own
- Acoustic treatment, including fabric-wrapped panels, ceiling baffles, and sound masking, tied the layout together as one system -- treating acoustics as a system rather than a single product avoids leaving loud and quiet zones adjacent to each other, which would undercut the zoning strategy elsewhere in the plan
- Shared workstations were equipped with height-adjustable desks, adjustable ergonomic chairs, monitor arms, and integrated power -- outfitting shared desks to this standard is what makes a hot-desking model usable rather than a downgrade from having an assigned desk [6]
- Every design change traced back to a specific finding from the original audit -- this traceability is what separates a data-driven redesign from a general aesthetic refresh, since each change has a documented reason tied to measured usage
What do the attendance and utilization results suggest about how durable this kind of change is?
- Average daily attendance rose from about 35% to about 65% -- a gain of this size, roughly doubling attendance, indicates the redesign addressed a root cause rather than producing a short-lived novelty bump
- The weekly attendance pattern became more even, correcting a sharp Tuesday spike and thin Mondays and Fridays -- reduced volatility suggests the office became useful across a full week rather than only on days when specific meetings forced attendance
- Meeting room availability improved as unused, oversized bookings gave way to right-sized huddle rooms -- this shows the earlier booking waste was a room-sizing problem that got solved directly, not a scheduling-behavior problem that required policy enforcement
- Employees reported more spontaneous, in-person collaboration after the redesign -- an increase in informal interaction is a behavioral outcome that is difficult to mandate through policy, which suggests the space itself was the mechanism driving the change
- The figures are presented as a composite, representative Boston-area example rather than one client's reported results -- this framing keeps the numbers useful as a planning benchmark without overstating them as a guaranteed outcome for any specific organization
- The gains came from removing friction rather than from tightening attendance policy -- changes driven by removed friction tend to persist because they change what people want to do, while policy-driven compliance typically holds only as long as the policy is enforced
What does the rent-at-risk calculation reveal about the financial case for redesigning underused office space?
- A 10,000-square-foot office at about $40 per square foot puts roughly $260,000 in annual rent at risk at 35% utilization -- expressing underused space in dollars rather than a percentage makes the cost of inaction legible to a finance audience, not just a facilities one [2]
- Raising utilization to about 65% drops that at-risk figure to roughly $140,000, a swing of about $120,000 a year -- a swing of this size on a single office reframes redesign spending as a rent-recovery project with a specific payback figure rather than an open-ended comfort investment [2]
- The rent-at-risk framing applies regardless of whether anyone is actively working in the underused space -- this is what makes the cost real and ongoing rather than theoretical, since the lease obligation exists independent of how the space gets used
- Utilization improvements compound with square footage, meaning larger offices see a proportionally larger dollar swing from the same percentage gain -- this scaling effect means the financial case for redesign generally strengthens as office size increases
- Lease renewal timing interacts directly with this calculation, since utilization data gathered 12 to 18 months ahead of a renewal can inform a smaller footprint at the same effective cost -- tying the audit timeline to the lease calendar turns a design project into a real estate strategy decision
- A rent-at-risk figure gives leadership a shared number to plan around instead of competing qualitative arguments about comfort versus cost -- a single quantified metric reduces the negotiation between finance and facilities to a shared target rather than two different value systems
What should Boston-area leaders prioritize before starting a workplace redesign of their own?
- Naming the specific business problem the office is failing to solve comes before any layout or furniture decision -- starting with a named problem, such as weak collaboration or an unjustifiable commute, keeps the redesign accountable to an outcome rather than a style preference
- Occupancy and booking data should be gathered before design work begins, not used to validate a plan already in progress -- data gathered first prevents the common failure of a redesign that reflects what a design team assumed rather than how the space is actually used
- Comparing booking logs against sensor or badge data exposes the specific gap between reserved space and used space -- this comparison is what identifies wasted capacity that a booking system alone would show as fully utilized
- A 30-day audit window is long enough to separate a temporary dip from a structural attendance pattern -- a shorter observation period risks reacting to a single unusual week rather than the underlying trend
- Lease timing should shape when the audit happens, ideally 12 to 18 months before a lease renewal -- this timeline gives leadership enough runway to act on the findings before a renewal decision locks in space commitments for years
- Attendance gains should be pursued through design changes rather than stricter attendance policy -- this priority order is the throughline of the entire example, since the office earned higher attendance by working better, not by requiring it