Space Utilization: The Office Metric Most Leaders Are Ignoring
Global unused office space sits near 33%. A single workstation costs up to $8,500 per year — at 35% utilization, $5,525 of that is wasted annually. A 10,000 sq ft office at 35% utilization puts $260,000 in annual rent at risk. Space utilization belongs on the leadership dashboard alongside headcount and labor costs.
Post Summary
Occupancy measures who was present in a space at a given time. Utilization measures how often specific desks, rooms, and zones are actually used over time. The distinction changes the decisions leaders can make. Occupancy data tells you attendance. Utilization data tells you whether the space is doing its job — and where it is not. When leaders track utilization by space type across desks, meeting rooms, and collaboration zones, they can set desk-sharing ratios with confidence, identify underperforming areas before lease renewal, and make layout changes based on how people actually work rather than how they were assumed to work.
A single workstation costs $5,900 to $8,500 per year in combined rent, furniture, utilities, and maintenance. At 35% utilization, between $3,835 and $5,525 of that per workstation is wasted annually. Scaled to the floor plan, a 10,000-square-foot office leased at $40 per square foot with 35% utilization puts approximately $260,000 in annual rent at risk. At 50% utilization that figure is $200,000, and at 65% it is still $140,000. Rent is only part of the cost — HVAC, cleaning, maintenance, and equipment expenses continue regardless of whether the space is occupied. The meter runs whether or not anyone is sitting there.
A meeting room that is reserved but sits empty is effectively taken off the board for everyone else who might have used it. Booking data alone shows demand signals — how often people are trying to reserve space. Sensor data shows actual use — whether people showed up. When booking logs and sensor data are compared, leaders can identify rooms that are consistently reserved without being used, adjust booking rules to free up capacity, and right-size rooms that are regularly booked for 12 people but used by two or three. That last pattern — large conference rooms hosting small groups — is one of the most common and expensive utilization problems in hybrid office environments.
Three interventions address the most common utilization gaps. Activity-based zoning replaces uniform desk rows with distinct zones for focus work, collaboration, and informal meetings — giving the floor plan purpose and reducing the dead space that rows of underused assigned desks produce. Flexible furniture including modular desks, movable tables, acoustic screens, and adjustable chairs allows the layout to shift in hours rather than weeks when team sizes or work patterns change. Right-sizing meeting rooms using utilization data converts large underused conference rooms into smaller huddle spaces and focus pods — a 12-person boardroom split into three 4-person huddle rooms increases availability and eliminates the ghost bookings that block access for everyone else. Together these interventions can reduce total office operating costs by up to 25%.
Many modern hybrid offices now target approximately 0.65 desks per employee rather than a one-to-one ratio. That ratio only works when leaders have utilization data that shows when demand peaks and can plan around it. Without that data, a 0.65 ratio is a guess that may leave teams without enough workspace on high-attendance days or maintain too many desks on low-attendance days. Utilization data by day, team, and zone is the foundation that makes desk-sharing ratios a confident data-driven decision rather than an estimate based on headcount alone.
If you’re paying for office space that people don’t use, you’re losing money every month. We’d put space utilization on the same dashboard as headcount, rent, and labor costs because it shows whether your office is earning its keep.
Here’s the short version: many offices run far below full use, with global unused space near 33% and hybrid office use often under 40%. That gap gets expensive fast when rent can top $40 per square foot and one workstation can cost $5,900 to $8,500 per year. The fix is not squeezing more people in. It’s using data to see which desks, rooms, and zones sit empty, then changing the layout to fit how people work.
Here's what it comes down to for us:
- Track utilization, not just occupancy. Presence alone does not show whether a space works well.
- Measure by space type. Desks, meeting rooms, and team areas need different data.
- Put a dollar figure on underuse. A half-empty office drains rent, utilities, cleaning, and furniture spend.
- Watch booked rooms that sit empty. Reserved-but-unused rooms block access for everyone else.
- Use the data to change the floor plan. Focus zones, shared team areas, smaller meeting rooms, and movable furniture can cut waste.
- Plan leases around usage, not guesses. That matters even more in hybrid schedules with uneven peak days.
A few numbers make the case fast:
- 35% utilization in a 10,000-square-foot office leased at $40/SF puts about $260,000 in annual rent at risk
- Many offices now target about 0.65 desks per employee
- Better use of shared space can cut office costs by up to 25%
Our takeaway: office space is not just a facilities line item. It’s a business cost, a layout issue, and a day-to-day work issue all at once. When we look at it that way, the next step is simple: measure what’s used, find what’s empty, and change the space before the next lease decision.

Measuring The Office Metrics that Matter
What office space utilization measures and why leaders should track it
To turn that gap into a decision, leaders need a metric that shows how each space performs. Office space utilization measures how often desks, meeting rooms, and collaboration zones are used over time.
Utilization vs. occupancy: the metric difference that changes decisions
Occupancy tells you who was there. Utilization tells you whether the space did its job. That difference matters more than it might seem at first.
When leaders look at utilization instead of presence alone, they can make sharper calls about space layout, desk-sharing ratios, and whether they should cut square footage. Occupancy data on its own can't do that. If utilization data shows an office is underused on certain days, that can shape lease planning, floor-plan changes, or a shift to more flexible space.
The numbers to monitor by space type
Different spaces need different metrics. A desk, a meeting room, and a collaboration zone don't behave the same way, so they shouldn't be judged the same way either.
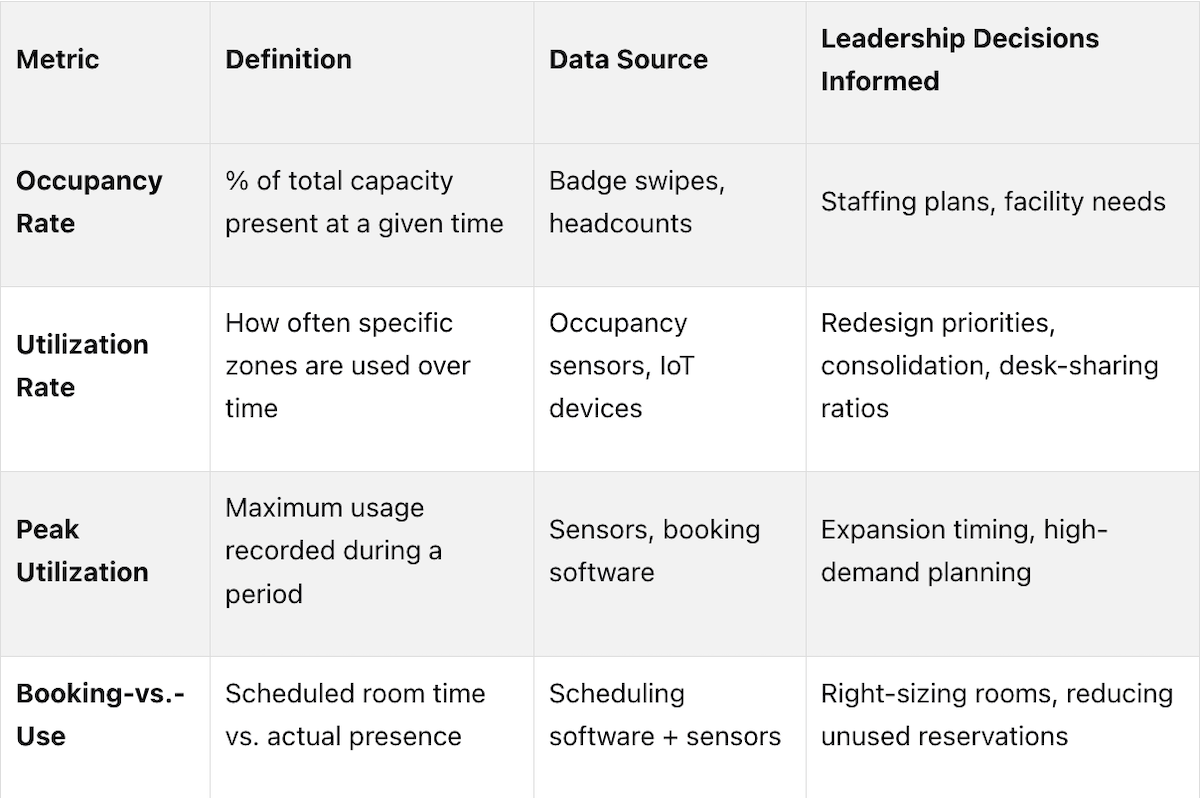
Booked time vs. used time deserves close attention. A room that gets reserved and then sits empty is basically taken off the board for everyone else. When you pair booking logs with sensor data, you can see where demand is real and where room assignments or booking rules need to change.
For workstations, it helps to track both average and peak utilization. That's what lets leaders set desk-sharing ratios with some confidence instead of guessing. Many modern offices are now targeting about 0.65 desks per employee [1]. But that ratio only works if leaders know when demand spikes and can plan around it. Those patterns show up in cost almost right away.
What poor utilization costs in real dollars and daily performance
The annual cost of underused square footage
When office space sits half-empty, the cost adds up fast. It’s not abstract. It shows up in rent, furniture, utilities, and the day-to-day expense of keeping space open that people barely use.
A single workstation can cost $5,900 to $8,500 per year [1]. If utilization is just 35%, about $3,835 to $5,525 per workstation each year is wasted [1].
That same pattern shows up at the floor-plan level too. In a 10,000-square-foot office with Class-A rent at $40 per square foot, the amount of annual rent at risk changes a lot depending on how much of the space people use [2]:
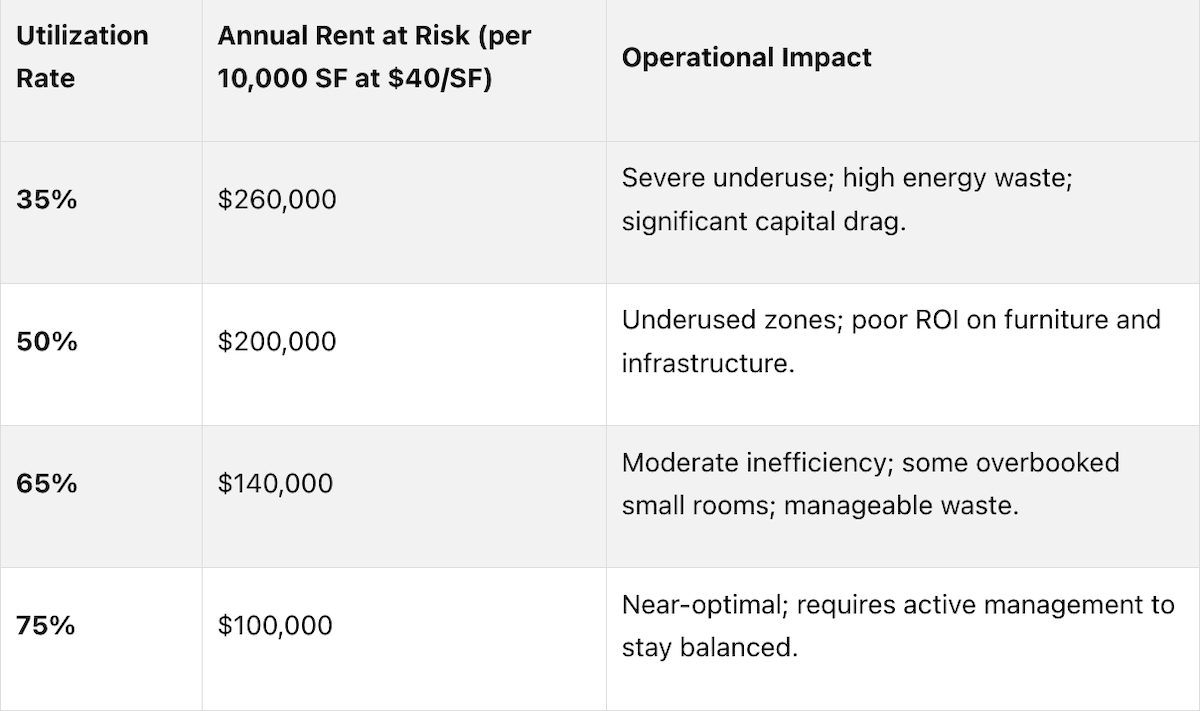
Note: Annual rent at risk calculated as (1 - Utilization Rate) * Total Annual Rent [2].
And rent is only one part of it. An underused office can still rack up costs for HVAC, cleaning, maintenance, and equipment. So even when the space looks quiet, the meter is still running.
How poor layouts reduce productivity and employee experience
The money matters, but people feel the layout problem first.
When the setup doesn’t match how teams work, small frustrations pile up. Meeting rooms that everyone wants are booked during peak times. Quiet areas are hard to find. People waste time hunting for a spot where they can focus or meet with others [3].
Comfort takes a hit too. If lighting is poor, ventilation is off, or the space feels too packed, it becomes harder to concentrate and do good work [3]. That kind of friction may seem small in the moment, but across a week or a month, it chips away at output and morale.
When you have the data in front of you, the conversation shifts from opinions to facts. You can clearly see how people are using the space, and that gives you the confidence to make changes that better support the way they work." - Mike Troia, CEO of Office Gallery
That’s the key tension: too much empty space burns cash, and too much crowding makes the office harder to use. Poor utilization isn’t just a lease issue. It’s also a space planning issue tied to how people work every day.
How to improve office space utilization with targeted design decisions
Once leaders can see where space sits empty, the next move is simple: redesign the floor plan around how people actually work.
Use activity-based zones to match how teams actually work
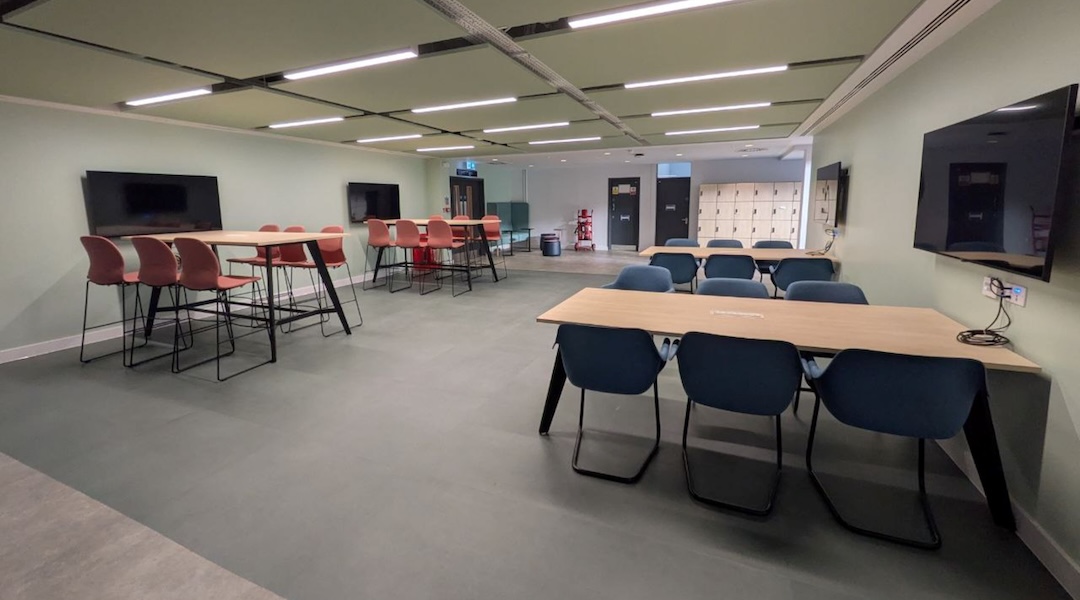
Activity-based design swaps fixed desk rows for spaces built around specific tasks. Instead of one uniform layout, the office is split into zones for focus work, collaboration, and informal meetings.
A setup like this gives the floor plan more purpose. People who need quiet time have a place for it. Teams that need to talk things through aren’t forced to do it at a desk.
Grouping the floor plan into "neighborhoods" where employees sit near the people they work with most can lead to more useful in-person interaction [4]. And that matters, because 86% of occupiers globally consider collaboration spaces a top priority in flexible office environments [5].
Zones shape the layout. Flexible furniture helps teams change it when work changes.
Choose flexible furniture that supports reconfiguration
Modular desks, movable tables, acoustic screens, and adjustable chairs make it possible to rework a space in hours instead of weeks. That means teams can adjust without paying for construction every time headcount shifts.
It’s a practical move. If a team grows, shrinks, or changes how it works, the space can change with it.
Right-size meeting rooms and shared spaces using utilization data
The same data should also point out rooms that are too big and shared areas that barely get used. Large conference rooms built for 12 people often host only 2 or 3. That’s a plain waste of square footage.
Utilization data makes the next step clear: find large rooms that stay underfilled, then split them into smaller huddle spaces or private focus pods [3]. One 12-person boardroom can become three 4-person huddle rooms.
The table below shows how each design move connects to a clear goal and a measurable result:
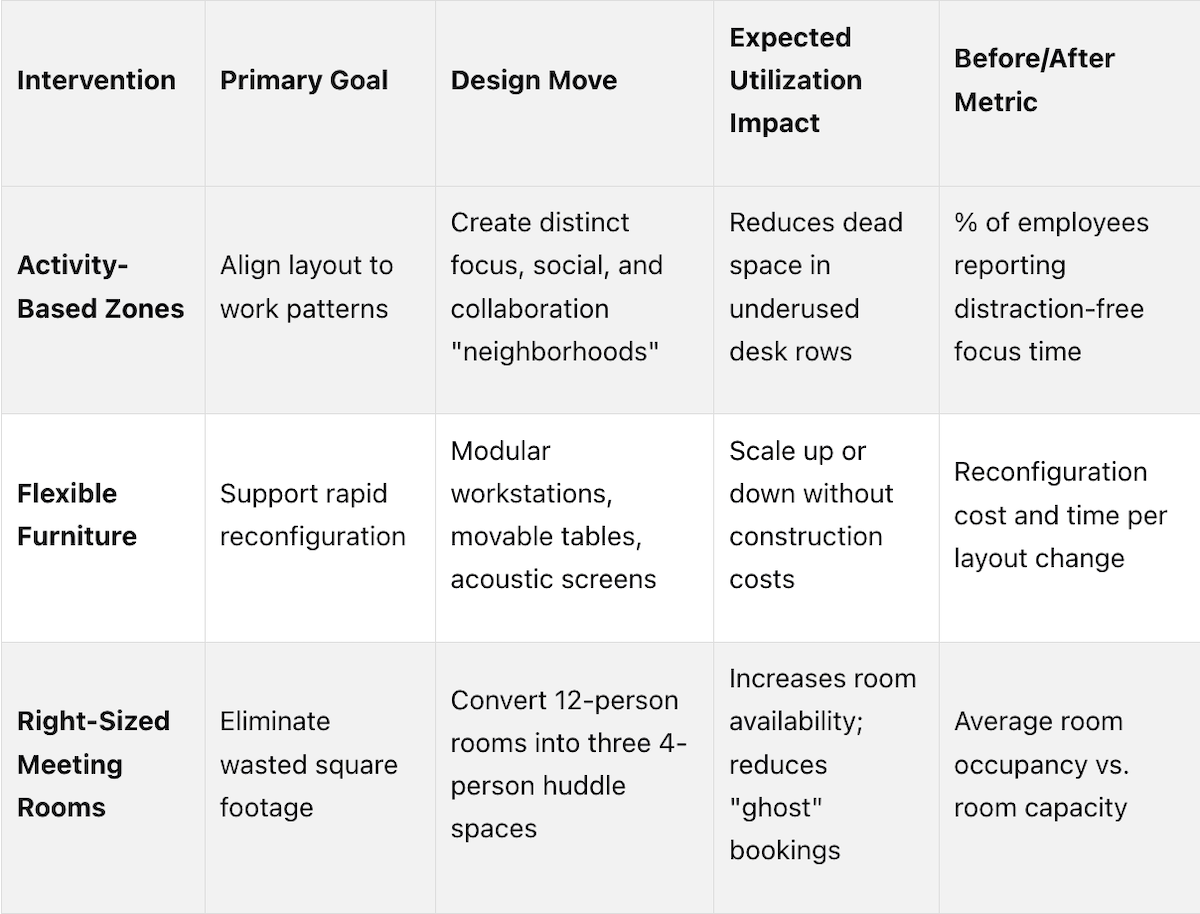
Efficient shared rooms and flexible zones can save organizations up to 25% on total office operating costs [1]. That’s the kind of number leadership pays attention to.
Conclusion: Treat space utilization as a business metric and design for measurable improvement
The data points to a clear takeaway: space utilization is not just a facilities issue. It’s a financial one. Empty or underused space costs money every single month, and leadership teams should respond to that data.
Here’s the core idea: when space goes unused, budgets take the hit. When layouts are shaped by usage data, that wasted spend can be cut back.
Better utilization does not mean squeezing more people into less space. It means aligning space with how people actually work so teams can do their jobs better. Flexible furniture, activity-based zones, and right-sized meeting rooms help turn utilization data into changes you can measure.
Key takeaways for Boston-area business leaders
For Greater Boston leaders, the next move is pretty straightforward: measure utilization by space type, fix layout mismatches before signing or renewing a lease, and invest in flexible furniture so the floor plan can shift without added construction costs. Start with the rooms and zones that sit empty most often.
As Megan Riley, Global Facilities Services Systems Supervisor at STERIS, put it when describing the shift to data-driven space decisions:
For oganizations looking to make their space work for them, Office Gallery can help turn utilization data into layout changes. Once utilization becomes a leadership metric, space decisions get faster, leaner, and easier to justify.
FAQs
How do you accurately measure office space utilization?
Accurate office space utilization measurement works best when you combine technology with behavior data. That gives you a clear picture of how people use space, whether you're looking at a single floor or your entire real estate portfolio.
A simple way to do this is to bring together a few data sources:
- Smart occupancy sensors to track real-time use and compare peak occupancy with average occupancy
- Booking software to measure demand for meeting rooms and focus spaces
- Space-to-headcount analysis to compare assigned space against headcount and role benchmarks using standards like IFMA or BOMA
Used together, these inputs show not just how much space you have, but how it’s actually being used day to day.
What is a good utilization rate for a hybrid office?
A good utilization rate for a hybrid office is about 60%–70% during peak demand. Put simply, that usually means about two-thirds of the workforce is in the office at the same time.
A lot of organizations are still well below that mark. Some see less than half of employees coming in, and others are under 40%. When that happens, it often points to an office footprint that's too large and not being used in a productive way.
How often should leaders review space utilization data?
Leaders should review space utilization data on a rolling basis and check any changes against occupancy and booking trends over time.
In practice, that means setting a regular cadence, such as a monthly review, to catch drift and spot consolidation opportunities. It also helps to run shorter-cycle checks on how spaces are actually being used, so teams can make timely scenario plans and budget decisions.
••••
If your office is ready for a similar transformation, whether you're in the Greater Boston area or farther out in New England, we'd love to talk. Visit our showroom at 151 Carnegie Row in Norwood, or call us at 781-762-3733 to schedule a consultation.
Key Points
Why does space utilization belong on the leadership dashboard alongside headcount, rent, and labor costs?
- Space cost as a compounding daily financial drain rather than a fixed overhead line item -- the cost of underused office space is not a one-time expense that appears on a balance sheet at year-end; it accrues every day a desk sits empty, every hour a meeting room goes unused after being reserved, and every month a lease payment covers square footage that contributes nothing to the business
- Global unused space near 33% and hybrid offices often running below 40% utilization establishing the scale of the problem -- these are not edge cases or outliers; they represent the typical utilization profile of offices that were designed for pre-pandemic full-time occupancy and have not been reconfigured to match hybrid attendance patterns
- $260,000 in annual rent at risk at 35% utilization in a 10,000-square-foot office making the financial stakes concrete -- this figure connects the abstract concept of utilization to a number that belongs in a budget conversation; leaders who understand that 35% utilization produces $260,000 in avoidable rent cost have the data to justify layout investment
- Rent as only one component of the full underuse cost -- HVAC, cleaning, maintenance, equipment, and furniture costs continue regardless of whether space is occupied; the total cost of underused space consistently exceeds the rent figure alone, which is itself already significant
- The leadership framing shift from facilities metric to business performance metric -- space utilization data presented as a facilities concern produces a facilities response; presented as a financial and operational performance metric alongside headcount, rent, and labor costs, it produces a leadership response that can authorize layout investment and lease decisions
- Utilization data enabling lease decisions based on evidence rather than assumption -- organizations that approach lease renewals without utilization data are committing to square footage based on headcount projections that may not reflect actual attendance patterns; utilization data by day and zone shows peak demand, average use, and the gap between them, making the right lease size a data-supported decision rather than a guess
What is the practical difference between occupancy and utilization data and why does the distinction change what leaders can do with the information?
- Occupancy answering who was there and utilization answering whether the space worked -- occupancy data from badge swipes and headcounts is attendance data; it tells leaders that a certain number of employees were in the building on a given day but cannot tell them whether those employees found suitable spaces to do their work effectively
- Utilization rate by zone revealing which specific areas are underperforming -- aggregate building occupancy of 60% masks the fact that desk zones may be at 90% on Tuesday and 30% on Thursday, that the large conference room sits empty four out of five days, and that the collaboration area is the most contested space in the building; zone-level utilization data makes these patterns visible
- Booking-versus-use gap as the meeting room metric that reveals hidden waste -- scheduling software shows bookings; sensor data shows actual presence; the gap between the two identifies the rooms that are being reserved without being used, which are effectively removed from availability for everyone else while contributing nothing to the building's utilization rate
- Peak utilization data preventing under-specification of desk-sharing ratios -- a 0.65 desk-to-employee ratio that is set without peak utilization data may produce a shortage on high-attendance days that erodes the trust employees place in the hot-desking system; peak data identifies the days and zones where demand concentrates and allows the ratio to be set with a realistic buffer
- The four key metrics by space type providing a complete utilization picture -- occupancy rate from badge swipes informs staffing and facility needs; utilization rate from sensors informs redesign priorities; peak utilization from booking software informs expansion timing; booking-versus-use from combined data informs room right-sizing; together they provide a complete picture that any single metric cannot
- Data shifting space decisions from opinion to evidence -- as Megan Riley of STERIS describes, utilization data removes the opinion dimension from space decisions and replaces it with direct evidence of how employees actually use the space; that shift changes what can be proposed, approved, and implemented in a leadership conversation about layout investment
What does the financial model for underused office space reveal about the true cost of poor space planning?
- $5,900 to $8,500 per workstation per year as the all-in cost that makes per-desk waste concrete -- this figure combines rent allocation, furniture amortization, utilities, and maintenance into a single per-position cost that makes the financial consequence of an empty desk immediately calculable; an office with 50 unused desks at this rate is losing $295,000 to $425,000 annually from workstation waste alone
- The utilization table from 35% to 75% showing that even near-optimal utilization carries significant rent at risk -- at 75% utilization, which represents active management and a well-functioning hybrid office, $100,000 in annual rent is still at risk in a 10,000-square-foot office; this figure establishes that utilization management is not a one-time fix but an ongoing operational discipline
- The meter running whether anyone is there or not as the framing that makes the cost visceral -- HVAC systems, cleaning crews, maintenance contracts, and equipment leases operate on schedules tied to the building rather than to its occupancy; an office running at 35% utilization incurs near-full operational costs for 65% of its capacity that produces no business value
- Productive inefficiency as the second cost layer beyond the financial one -- the financial cost of underuse is calculable; the productivity cost is less visible but equally real; employees who cannot find suitable focus space, who lose meeting rooms to ghost bookings, or who work in crowded zones while adjacent areas sit empty experience friction that reduces output and accumulates into the morale and retention risks that workforce surveys identify
- Up to 25% reduction in total office operating costs from better space utilization establishing the return on layout investment -- this figure provides the other side of the ROI calculation; the investment in activity-based zones, flexible furniture, and right-sized meeting rooms produces a measurable operating cost reduction that organizations can set against the cost of the design changes
- The lease decision as the highest-stakes utilization data application -- the financial consequences of poor space planning are at their most severe when they are locked into a multi-year lease that commits to square footage that will not be used; utilization data collected before lease renewal is the most valuable input available for right-sizing the commitment
How do activity-based zones address the specific utilization failures that uniform desk layouts produce?
- Uniform desk rows producing the utilization paradox of simultaneous overcrowding and emptiness -- in a standard open-plan layout with uniform desk rows, high-attendance days concentrate employees in preferred zones while leaving others empty, and specific work types compete for spaces that were not designed for them; activity-based zoning resolves both problems by design rather than by policy
- Focus zones reducing the distraction that drives employees to work from home on focused-task days -- the attendance data consistently shows that employees choose home for focused individual work and come to the office for collaboration; a floor plan with no dedicated focus zone is a floor plan that actively supports the preference for remote work on the days when individual output is highest
- Collaboration neighborhoods increasing the purposeful in-person interaction that motivates hybrid attendance -- grouping employees near the people they work with most creates the spontaneous interaction and team cohesion that remote work cannot replicate; 86% of occupiers globally identify collaboration spaces as a top priority in flexible office environments, establishing that this is not a design trend but an occupier-stated requirement
- The neighborhood model reducing search friction on high-attendance days -- when teams know where to find each other in the office, the time spent searching for colleagues, suitable meeting spaces, and available desks decreases; that reduction in daily friction is one of the practical benefits of activity-based zoning that survey data consistently identifies as a driver of in-office preference
- Activity-based zones enabling the data collection that improves utilization over time -- once the floor plan is organized by zone type, utilization data by zone becomes actionable; a focus zone that is consistently overcrowded can be expanded; a collaboration area that sits empty can be repurposed; the zone-based layout creates the measurement infrastructure that makes continuous improvement possible
- The connection between zone design and lease right-sizing -- organizations that understand which zone types their employees actually use at what frequency can size their next lease around those patterns rather than around theoretical maximum occupancy; that connection between utilization data, zone design, and lease commitment is the full strategic value of treating space utilization as a leadership metric
How should flexible furniture specification be approached to support utilization improvement and reduce reconfiguration cost?
- Modular furniture enabling reconfiguration in hours rather than weeks as the operational flexibility argument -- the primary business case for flexible furniture over fixed installation is the cost and time of reconfiguration; when a team grows, shrinks, or shifts its work pattern, modular desks and movable tables allow the floor plan to respond immediately rather than requiring construction timelines and budget approvals
- Acoustic screens providing zone definition without permanent partition construction -- freestanding acoustic screens can define focus zones, create visual privacy at collaboration clusters, and reduce ambient noise transmission between areas without the cost and disruption of wall construction; they can be repositioned as zone needs change and removed entirely if the layout shifts fundamentally
- Adjustable chairs and height-adjustable surfaces supporting the full range of users in a shared desk environment -- in a hot-desking or activity-based layout where multiple users occupy the same position across a day or week, furniture that adjusts to each user's body dimensions maintains ergonomic performance that fixed furniture cannot provide for a diverse user population
- Movable tables enabling rapid reconfiguration for different meeting and collaboration formats -- a collaboration zone furnished with movable tables can host a team workshop in the morning and a small group meeting in the afternoon without requiring separate dedicated rooms for each format; that flexibility multiplies the effective capacity of the collaboration area without increasing its square footage
- The reconfiguration cost comparison between flexible furniture and fixed construction -- organizations that rely on construction for every layout change pay construction costs, accept construction timelines, and absorb the operational disruption of renovation; organizations with modular furniture pay moving costs measured in staff hours; over the lifecycle of a 10 to 15 year commercial furniture investment, that difference compounds significantly
- Flexible furniture as the infrastructure that makes utilization data actionable -- utilization data identifies what needs to change; flexible furniture makes it possible to change it quickly enough to respond to the patterns the data reveals; without the physical flexibility to reconfigure, utilization data produces insight without action
How should Greater Boston organizations sequence their space utilization improvement program and what role does Office Gallery play?
- Measurement before investment as the non-negotiable first step -- organizations that invest in layout changes before measuring utilization are solving assumed problems rather than actual ones; the 30-day space-use audit that identifies actual desk occupancy by day, zone utilization by type, and booking-versus-use gaps in meeting rooms is the prerequisite for every subsequent design decision
- Dollar quantification of underuse making the investment case internally -- once utilization data is in hand, converting it to dollar cost at current lease rates produces the financial argument that moves layout investment from a facilities request to a business performance initiative; the gap between current rent cost and utilized space value is the number that belongs in the leadership conversation
- Prioritizing the highest-waste areas first to demonstrate return before full commitment -- organizations uncertain about full-floor reconfiguration benefit from addressing the single highest-waste zone first, measuring the utilization improvement after the change, and using that documented return to justify the subsequent phases; this sequencing converts projected ROI into demonstrated ROI before the larger investment is committed
- Lease timing as the critical window for utilization-informed decisions -- the most consequential utilization decision is made at lease renewal when square footage is committed for the next five to ten years; organizations that collect and analyze utilization data in the 12 to 18 months before lease renewal have the evidence needed to right-size their commitment; those that do not are guessing at the same cost per square foot
- Office Gallery's space planning capability converting utilization data into actionable floor plans -- the transition from utilization data to a floor plan that addresses the identified gaps requires space planning expertise that connects measurement findings to furniture specification, zone design, and implementation sequencing; Office Gallery provides this capability for Greater Boston organizations as part of its on-site consultation and project management service
- Contact Office Gallery at 781-762-3733 or visit the showroom at 151 Carnegie Row in Norwood -- serving Beverly, Marlborough, Plymouth, Quincy, Waltham, and surrounding Greater Boston communities, Office Gallery works with organizations at every stage of space planning, from the initial utilization assessment through the finished reconfigured environment; for organizations approaching a lease decision or managing the underuse costs that hybrid attendance has created, the conversation starts with a space assessment