
What Workplace Design Actually Returns: The Business Case for Office Investment
Payroll is 90% of operating costs — a 1% to 5% shift in output, absenteeism, or turnover means $50,000 to $700,000 annually in a 50-person office. Office space averages just 42% utilization. Replacing one skilled employee costs up to 200% of salary. Office Gallery makes the business case for workplace design investment.
Post Summary
Payroll represents approximately 90% of operating costs for most organizations — which means even a 1% to 5% improvement in output, turnover, absenteeism, or space utilization can translate to $50,000 to $700,000 or more annually in a 50-person office. The business case for workplace design investment rests on three measurable cost categories: the cost of poor design through noise, weak focus, collaboration friction, and absenteeism; the return from intentional investment through productivity gains of 10% to 25%, 19% lower absenteeism, and stronger retention; and the ongoing cost of underutilized space, with corporate office utilization averaging just 42%. Treating workplace design as a business investment with a traceable return — not an aesthetic or facilities decision — is the foundation of making that case to any leadership team.
The most financially significant failure modes of poor office design are noise distraction, turnover, and space underutilization. In open-plan offices, workers are interrupted every 11 minutes on average and need approximately 25 minutes to return to their original task — at 60 to 70 decibels, far above the 35 decibel ambient noise level recommended for sustained cognitive focus. Replacing a skilled employee costs 50% to 200% of annual salary, with new hires typically needing eight months to reach full productivity. Corporate office space utilization averages just 42%, meaning most organizations are paying rent on space that sits empty more than half the time. Only 26% of office workers strongly agree that their workplace helps them do their best work — a signal of the engagement and retention risk that accumulates when the environment consistently creates rather than reduces friction.
Strategically designed workplaces have been linked to productivity increases of 10% to 25%, with the Design Council citing 20% for intentionally designed environments. Strong acoustic control can produce up to two times more focus time per employee, while better lighting improves productivity by 6.7% with access to natural light pushing that to 12%. Ergonomic design improvements have been linked to a 16% higher presenteeism score and 19% lower absenteeism. Employees in well-designed workplaces are nearly three times more likely to stay with their company, and organizations that invest in the right mix of focus, collaborative, social, and restorative spaces report voluntary attrition 15% to 25% lower than sector peers. Employees who can choose where and how they work are 2.5 times more likely to say their workplace supports their productivity.
Office investment ROI uses the standard formula — gains minus investment divided by investment, multiplied by 100 — with gains measured in labor, space, and turnover costs rather than aesthetic or square footage terms. Even a 1% improvement in employee performance can be enough to outweigh the cost of a furniture upgrade or acoustic retrofit. The calculation connects each benefit to a clear data source: payroll records for productivity, HR analytics for turnover, and booking system data for space utilization. A before-and-after model for a 50-person office with average salaries of $100,000 and a $500,000 annual lease shows total labor and real estate exposure of $5.5 million — at 15% voluntary turnover, that office loses approximately $350,000 or more in annual replacement costs before factoring in productivity, absenteeism, or utilization losses. ROI is best tracked across three to five years with measurements at three, six, and twelve months post-installation.
The highest-return workplace upgrades address the conditions that directly affect human capital performance — because salaries represent approximately 90% of operating expenses, a 1% productivity gain outweighs most rent or energy savings. The priority upgrade categories are indoor environmental quality including air and lighting, acoustic and spatial zoning that maintains ambient noise at or below 35 decibels, ergonomic infrastructure including height-adjustable workstations and certified seating, and activity-based space planning that provides focus, collaborative, social, and restorative zones. Real estate optimization through right-sizing to actual utilization patterns addresses the 42% average utilization gap directly. WELL-certified offices have shown lower absenteeism in post-occupancy studies, and both LEED and WELL provide reportable health and sustainability metrics for corporate reporting.
Office design affects business results. If payroll is about 90% of costs, then even a 1% to 5% negative shift in output, turnover, absenteeism, or space use can mean losing $50,000 to $700,000+ every year in a 50-person office.
Here’s the short version:
- Bad office design costs money through noise, weak focus, missed meetings, absenteeism, and churn.
- Good office design can pay back through better acoustics, lighting, ergonomics, and layout.
- Companies often waste money on low space use too, with office use averaging about 42%.
- Replacement costs hurt: losing one skilled employee can cost 50% to 200% of salary.
- Better workplaces are linked to 10% to 25% productivity gains, 19% lower absenteeism, and stronger retention.
- The right way to judge office spend is simple: compare labor value, rent, turnover, and usage before and after the project.
If I were making the case to leadership, I’d keep it plain: this is not about looks. It’s about whether the office helps people do their jobs, whether space is being used, and whether the spend earns back more than it costs.
Simply:
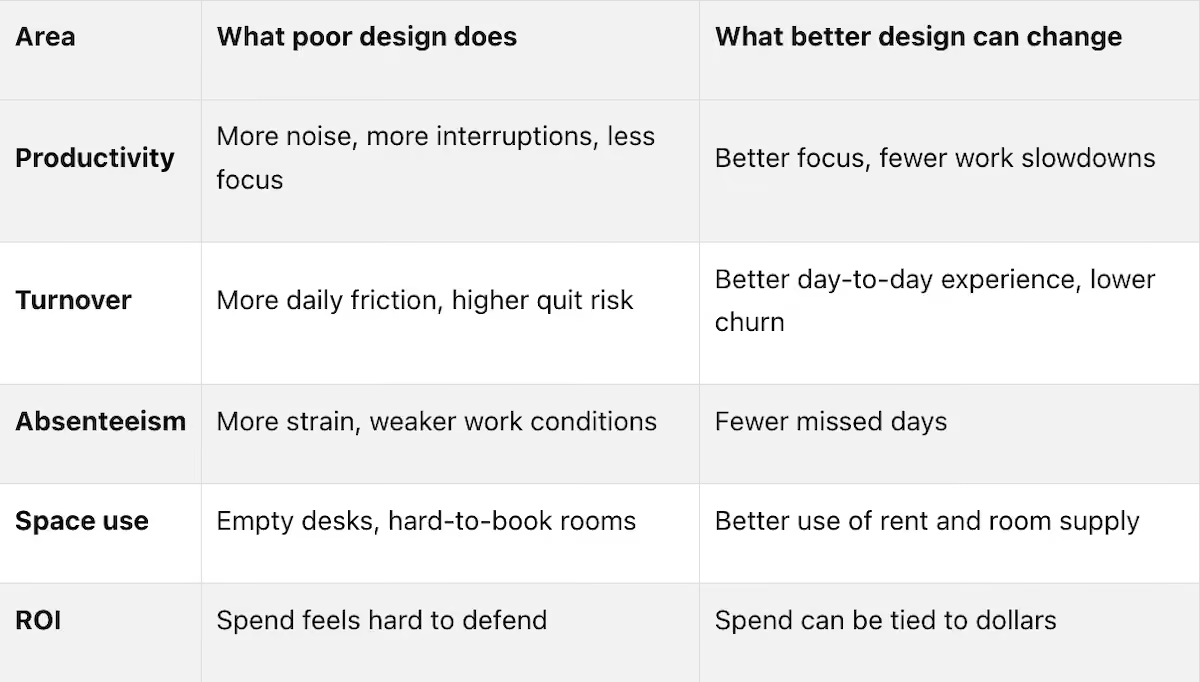
Bottom line: I’d treat workplace design like any other business investment. If it lowers friction and improves output, retention, and usage, it has a business case - not just a design case.
The cost of getting workplace design wrong
Disengagement, absenteeism, and lost output add up fast
A poorly designed office drains money in quiet, steady ways: lower output, more mistakes, absenteeism, and presenteeism.
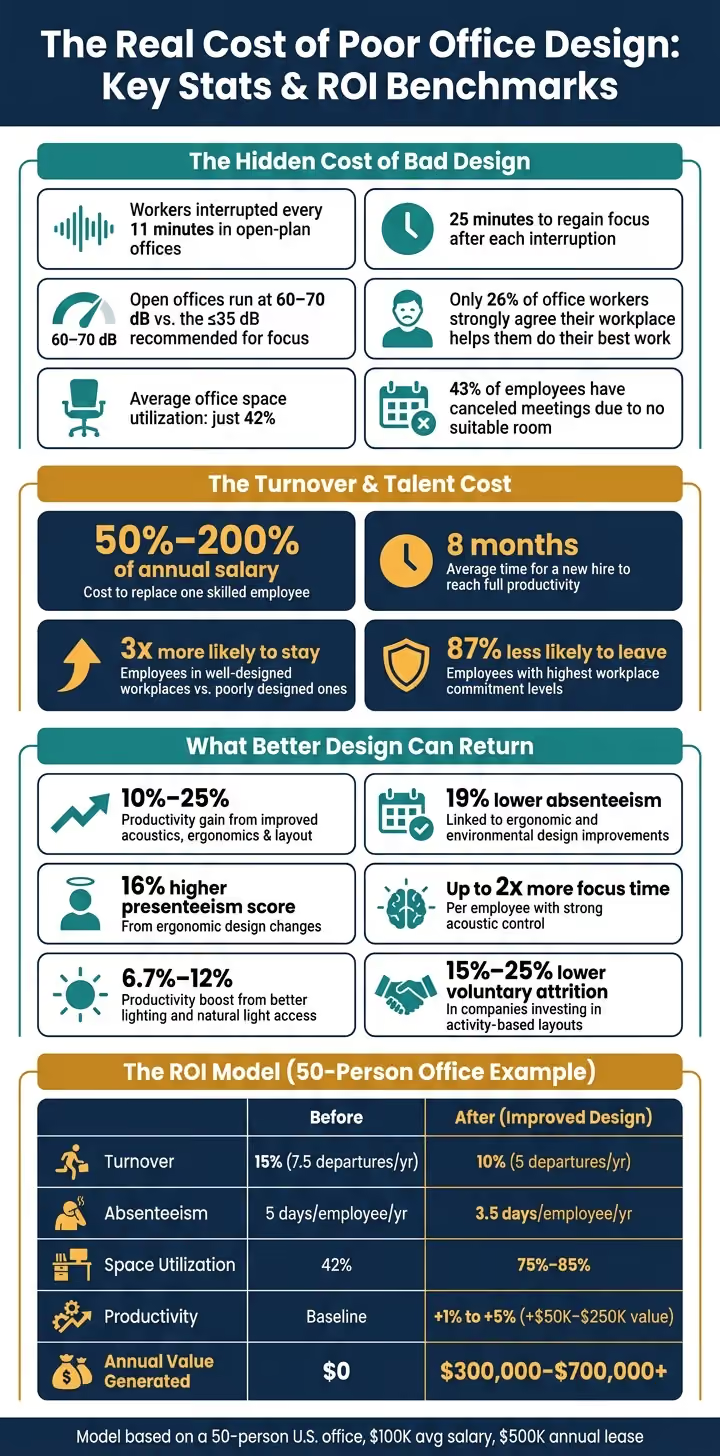
Noise is the biggest repeat offender. In open-plan offices, workers get interrupted every 11 minutes on average and need about 25 minutes to get back to their original task [8]. That adds up fast over the course of a day. Many open-plan offices also run at 60–70 dB, which is far above the ≤35 dB ambient noise level recommended for sustained focus [3].
Air and light matter too. Poor indoor air quality, including high CO2 levels, can hurt concentration. Weak lighting does the same. On the flip side, better indoor environmental quality has been linked to productivity gains of 8% to 11% [3]. Design changes have also been linked to a 16% higher presenteeism score and 19% lower absenteeism [3].
Turnover and replacement costs make poor environments expensive
When the workplace wears people down, turnover goes up. And replacing people isn’t cheap. Replacing a skilled employee usually costs between 50% and 200% of their annual salary [6]. Then there’s the ramp-up period: new hires often need about 8 months to reach full productivity [6].
That cost gets harder to ignore when you look at how people feel about their current space. Only 26% of office workers strongly agree that their workplace helps them do their best work [9]. Meanwhile, employees in well-designed workplaces are nearly 3 times more likely to stay with their company [9].
That gap matters. If people feel blocked by the space around them day after day, attrition risk starts to grow.
Unused space and collaboration friction waste rent and time
A lot of office space simply isn’t being used. Corporate office space utilization averages just 42% [2]. Put plainly, many companies are paying rent on space that sits empty more than half the time.
And the waste doesn’t stop at empty desks. 43% of employees have canceled meetings because no suitable room was available [8]. That creates friction in places where work is supposed to move forward. Decisions get pushed back, projects slow down, and rent delivers less value than it should.
Those losses are the starting point for the ROI that comes next.
What intentional workplace investment can return
Productivity gains from acoustics, ergonomics, and space planning
Workplace design can do more than make an office look good. When companies improve acoustics, ergonomics, lighting, and space planning based on evidence, productivity can increase by 10% to 25%. The Design Council puts that figure at 20% for strategically designed workplaces [3][4].
Acoustics has a big effect here. In open-plan offices, 37% of workers say noise hurts their productivity [3]. On the flip side, strong acoustic control can lead to up to 2x more focus time per employee [3]. That’s why high-performance offices don’t treat every area the same. They move from open collaboration zones to quieter enclosed rooms and pods, and they keep ambient noise at ≤35 dB, the level linked with cognitive focus [3].
Lighting matters too. Better lighting can improve productivity by 6.7%, while access to natural light and window views can push that to 12% [3]. It’s a simple idea, but it holds up in practice: people tend to work better when they can see well and don’t feel boxed in.
Ergonomics has a measurable effect as well. Ergonomic design led to a 16% increase in presenteeism scores and a 19% improvement in absenteeism [3]. And when employees can choose where and how they work, the payoff gets stronger. They are 2.5 times more likely to say their workplace supports their productivity [8]. Height-adjustable workstations and certified ergonomic seating help turn that choice into something practical, not just a nice idea.
When you spread those gains across an entire workforce, the next return tends to show up in retention.
Retention and engagement improve when the workplace supports how people work
Replacing a skilled employee costs 50% to 200% of annual salary [6]. So when office design cuts down on daily headaches like noise, poor air quality, and a lack of spaces for different kinds of work, it can lower turnover risk in a very direct way.
Commitment is a big part of that picture. Employees with the highest commitment levels are 87% less likely to leave their organization [5]. And the workplace plays into that more than many leaders assume. 90% of employees who like their workspace say they are proud to work for their company, compared with 47% of those who feel disconnected from it [8].
The Fellowes Workplace Wellness Trend Report points in the same direction. It found that 93% of workers in tech said they would stay longer at a company that offers healthier workplace benefits. That includes ergonomic design, wellness spaces, and better environmental quality [3].
The point isn’t that office design fixes every people problem. It’s that the workplace can either add friction every day or remove it. That difference shapes whether or not people want to stay.
Collaboration improves when layout reduces friction
Teams work better when the office gives them the right mix of settings. A workplace that includes focus, collaboration, social, restorative, and learning spaces reduces friction in daily work [7]. People don’t have to force every task into the same kind of room.
Layout choices matter here. Team-based seating, where teams anchor to shared zones instead of competing for any open desk, reduces the daily hassle of finding coworkers [7]. Cafés and lounges help too. Those spaces support the unplanned conversations that often keep projects moving [7].
This kind of setup also shows up in talent outcomes. Companies that invest in these layouts often report voluntary attrition 15% to 25% lower than sector peers [7]. They can also cut time-to-hire by 20% to 30% [7], which suggests the workplace itself helps pull in candidates.
There’s also a clear signal in current demand. 2026 booking data shows that focus-room demand exceeds collaboration-room demand by 30% to 50% [7]. In plain English, many offices still don’t have enough space for concentrated individual work, even though hybrid schedules have made that need more obvious. That gap is a big reason office ROI should be measured in labor, space, and utilization, not finishes alone.
“The open office has been great. It has allowed us to collaborate and interact easily with one another, but the need for some privacy remains. You still need to call your doctor, significant other, or find time to focus on a project. Dedicated privacy solutions like small single person pods or larger meeting pods provide that space, and show employees that you care.” - Mike Troia, CEO of Office Gallery
How to calculate office investment ROI in business terms
A simple ROI formula tied to labor, space, and risk
Those losses only start to matter in a business case when you turn them into labor, space, and turnover costs.
Use the standard ROI formula: [(Gains – Investment) / Investment] × 100 [4]
Start with the gains you can measure in dollars: productivity, turnover, absenteeism, and space use. Even a 1% improvement in employee performance can be enough to outweigh the cost of a furniture upgrade or acoustic retrofit [1][8].
When you build the case, connect each benefit to a clear data source. For example:
- payroll records for productivity
- HR analytics for turnover
- booking system data for utilization
That makes the math easier to defend when leadership reviews it.
A before-and-after model for a typical U.S. office
Here’s what that can look like in a typical office budget.
Model based on a hypothetical 50-person U.S. office with an average salary of $100,000 and a $500,000 annual lease [2][4].
Take a 50-person U.S. office with an average salary of $100,000 and an annual lease of $500,000. That puts total annual labor and real estate exposure at $5.5 million.
At a 15% voluntary turnover rate, that office loses about 7 to 8 employees per year. Replacing each person can cost between 50% and 200% of their annual salary [7]. Even at the low end, that adds up to $350,000 or more in annual replacement costs. And that’s before you factor in productivity, absenteeism, and utilization.
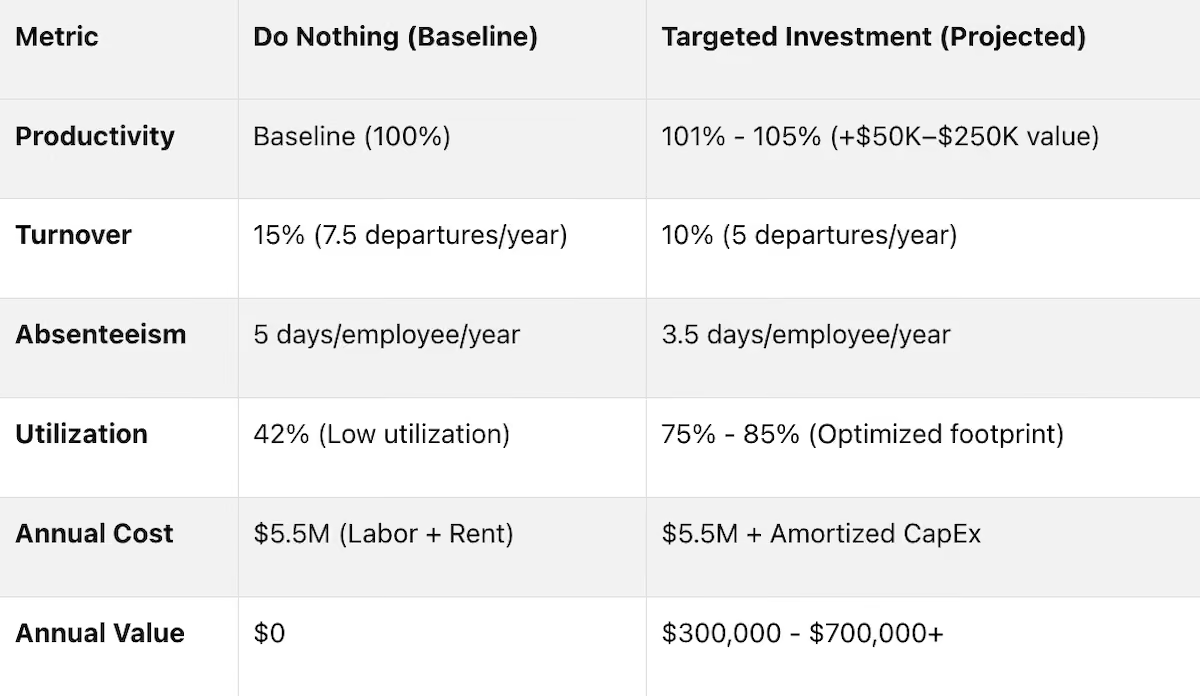
Add a 10% to 15% contingency and model ROI over 3 to 5 years [2][4].
Metrics to track after installation
ROI measurement doesn’t end when the project wraps up. You need a clean before picture and a matching after picture, or the results won’t mean much.
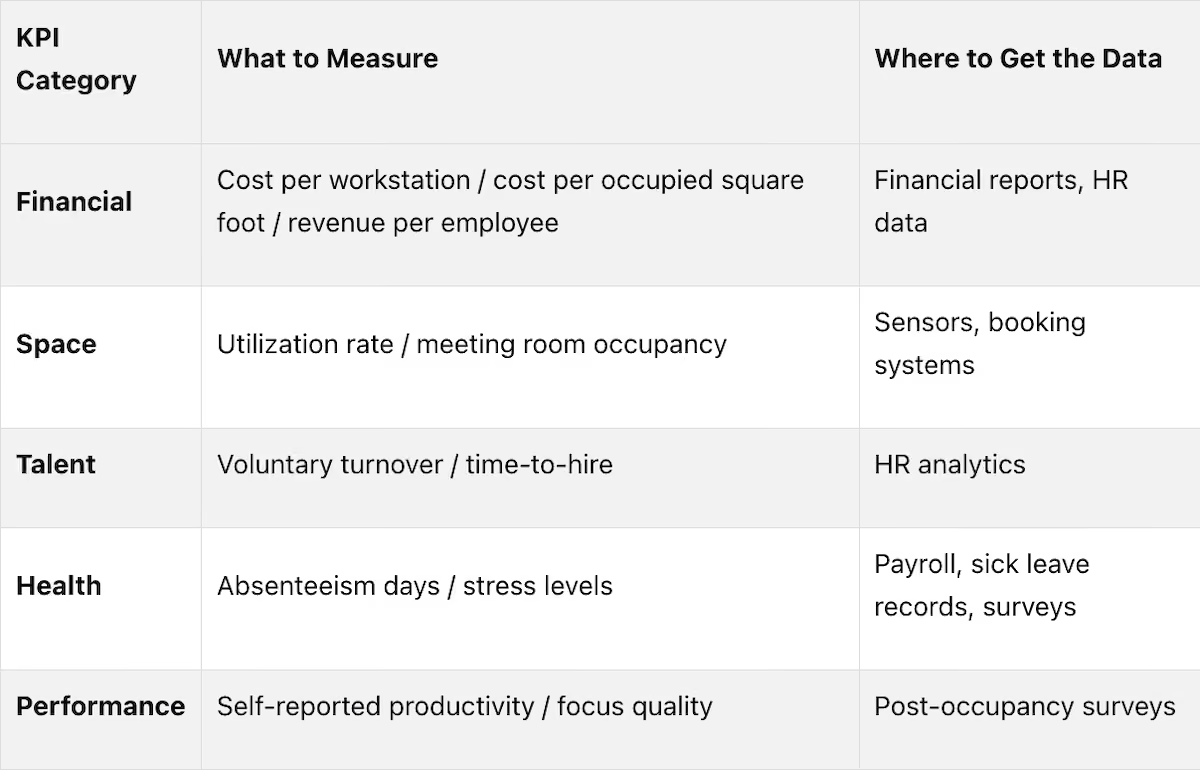
Before work starts, run an anonymous workplace survey and pull utilization data from badge swipes or desk booking systems. That baseline is what gives your post-occupancy numbers meaning. Then repeat the same measurements at the 3-month, 6-month, and 12-month marks to track the actual delta [1][2][4].
The main KPIs usually fall into a few simple buckets:
One tool worth knowing: the Leesman Index is a standardized workplace effectiveness survey used by organizations globally to benchmark employee experience before and after a fit-out [1][7]. It gives you a consistent, comparable score instead of a one-off internal poll.
Track these metrics to confirm performance gains and shape the next investment. In Greater Boston, the same model also needs to account for safety and material compliance.
Applying the business case in Greater Boston workplaces
Safety and compliant materials are part of ROI
In Greater Boston, ROI isn't just about desks, layouts, and headcount. It also includes fire risk, code compliance, and the cost of replacing damaged materials.
Compliance is a cost-control issue, not a box-checking exercise.
Fire-resistant upholstery, foam, panels, and finishes - including materials that meet California TB 117-2013 standards - can lower ignition risk and cut replacement cost. That matters because when materials meet code, the workplace helps protect labor output instead of adding avoidable risk.
WELL-certified offices have shown lower absenteeism in post-occupancy studies, and LEED and WELL also give organizations reportable health and sustainability metrics for corporate reporting requirements [1].
How Office Gallery International supports measurable workplace outcomes
Office Gallery International supports Greater Boston projects with space planning and installation tied to workplace results like productivity, focus, and retention.
Each solution area maps to a clear outcome:
- Ergonomic seating and height-adjustable workstations support productivity
- Acoustic solutions support focus and reduce noise
- Conference rooms, reception areas, and breakrooms support collaboration and retention
To measure results, use the same labor, space, and utilization metrics from the ROI model. Then track the same survey and utilization data after installation to confirm ROI.
Conclusion: The return comes from performance, not appearance
Poor workplace design has a real price tag. It shows up in disengaged employees, avoidable turnover, underused square footage, and collaboration that never quite gets off the ground.
A focused investment in the right environment - acoustics, ergonomics, layout, and compliant materials - can lead to measurable gains in productivity, retention, space efficiency, and collaboration.
The companies that make this case well inside the business usually do one thing right: they talk in dollars, not aesthetics. Treat each design decision like a business investment with a traceable return, and the math starts to speak for itself.
The Good, the Bad, and the Ugly of Office Design | Amanda LeClair | TEDxNatick

FAQs
How soon can office design ROI show up?
Workplace design ROI usually shows up within 12 to 18 months, although some wins can appear earlier.
- Space utilization savings: 6 to 9 months
- Productivity gains: 9 to 15 months
- Tech-heavy investments: 18 to 24 months
- Retention gains: often within the first year
If you want the full picture, track results over 3 to 5 years. That’s when the payoff tends to build over time.
Which workplace upgrades deliver the biggest return?
The biggest payoffs usually come from upgrades that improve human capital.
Why? Because salaries can make up as much as 90% of operating expenses. So even a 1% gain in productivity can beat major savings on rent or energy. That’s a big deal.
This is why workplace upgrades often focus on the day-to-day conditions that shape how people work, think, and feel, such as:
- Real estate optimization
- Indoor environmental quality
- Acoustic and spatial zoning
- Ergonomic infrastructure
- Targeted amenities
How can we measure office ROI in a hybrid workplace?
Measure office ROI in a hybrid workplace by linking design choices to business results, not just occupancy rates. The goal isn’t simply to see whether desks are full. It’s to show how the space affects the business.
Start with a baseline. Use pre-occupancy surveys along with 4 to 8 weeks of utilization data before you make comparisons.
Then look at impact across a few core areas:
- Real estate efficiency
- Retention
- Productivity and absenteeism
After people move in, check the numbers again 6 to 12 months later. That second review helps confirm improvement and gives leadership a clear view of the payback period.
•••
Ready to transform your workspace? Contact us today to explore how our expert team can design a tailor-made solution that aligns with your brand and enhances productivity. From design inspiration to project management, we'll guide you through every step of the process to create an office space that fosters creativity, collaboration, and success. Let's embark on a journey to redefine your workspace together.
Key Points
Why should workplace design be evaluated as a business investment rather than a facilities or aesthetic decision?
- Payroll at 90% of operating costs making labor productivity the highest-return investment variable -- when salary expense dominates the cost structure, the physical environment that affects how effectively that salary generates output is a primary business performance lever; a 1% productivity improvement across a 50-person team at $100,000 average salary is worth $50,000 annually -- a return that most furniture or acoustic investments recover within the first year
- The $50,000 to $700,000 annual impact range in a 50-person office establishing financial materiality -- this range, derived from 1% to 5% shifts across output, turnover, absenteeism, and space utilization, makes the financial stakes of workplace design decisions concrete and comparable to other capital allocation decisions leadership teams evaluate regularly
- 42% average corporate office utilization representing direct rent waste -- at this utilization rate, organizations are effectively paying for roughly twice the productive space they actually use; the financial waste of underutilized space is a quantifiable cost that workplace design and furniture reconfiguration can directly address through right-sizing and activity-based planning
- The leadership framing distinction between design cases and business cases -- workplace investments that are presented to leadership as design improvements are evaluated as costs; those presented in terms of labor value, turnover reduction, space efficiency, and productivity return are evaluated as investments with expected returns; the framing determines the outcome of the approval conversation
- 3 to 5 year ROI horizon capturing the compounding returns of retention and productivity improvement -- single-year ROI calculations understate the value of workplace investments because retention improvements compound across multiple years as the cost of replacement hiring, onboarding, and productivity ramp-up is avoided repeatedly; modeling over three to five years captures the full return that annual calculations miss
- Before-and-after measurement as the proof structure that makes the case defensible -- the ROI case for workplace investment is only as strong as the data supporting it; organizations that establish a documented baseline before investment and measure the same metrics after can defend the return with evidence rather than assertion; those that do not have before data cannot make the case even when the improvement is real
What are the most financially significant failure modes of poor office design and how does each translate to measurable cost?
- Noise distraction at 60 to 70 decibels producing an interruption every 11 minutes -- at this interruption frequency, sustained cognitive work -- the kind that generates the most value from knowledge workers -- is structurally impossible; the 25-minute recovery time per interruption means that even five interruptions in a morning session consume more than two hours of productive cognitive capacity before lunch
- 37% of workers citing noise as a direct productivity impairment establishing distraction as a majority-scale problem -- this is not a minority sensitivity issue affecting a small number of noise-sensitive employees; more than one-third of the workforce in typical open-plan environments identifies noise as a specific impediment to their work output, making acoustic management a productivity intervention that scales across the team
- 50% to 200% of annual salary replacement cost making turnover the highest single avoidable cost in the model -- at a 15% voluntary turnover rate in a 50-person office, replacing seven to eight employees annually at even the low end of the replacement cost range produces $350,000 or more in direct and indirect costs; the proportion of that turnover driven by workplace friction is the variable that workplace investment directly influences
- Eight-month new hire productivity ramp extending the true cost of turnover beyond replacement expenses -- the financial model for turnover that stops at replacement cost understates the actual loss; eight months of sub-full-productivity from each new hire represents a sustained output gap that compounds the direct replacement cost and extends the financial impact of every departure
- 43% of employees canceling meetings due to unavailable suitable rooms converting space scarcity into collaboration cost -- canceled meetings are not neutral events; they delay decisions, slow projects, and create the rescheduling friction that reduces the velocity of work across the organization; this collaboration cost is directly traceable to space planning and meeting room design decisions
- Only 26% of office workers strongly agreeing their workplace helps them do their best work establishing the engagement baseline -- this figure represents the starting point from which workplace investment improvement is measured; organizations at or below this baseline are paying full salary cost for a workforce operating significantly below its potential output, with the gap traceable to environmental rather than individual factors
What specific design interventions produce the documented productivity, retention, and collaboration returns?
- Acoustic control to at or below 35 decibels enabling up to two times more focus time per employee -- the doubling of focus time from acoustic management to the recommended threshold is not a marginal improvement; it represents the difference between an environment where deep work is possible and one where it is not, with direct implications for the quality and volume of knowledge work output
- Lighting improvement producing 6.7% productivity gain with natural light access pushing that to 12% -- these gains are achievable without structural renovation through lighting upgrades, fixture repositioning, and window access prioritization in desk placement; at 12% productivity improvement from natural light access alone, the return on any furniture reconfiguration that increases natural light exposure at workstations is calculable from the first year
- Ergonomic infrastructure linked to 16% higher presenteeism score and 19% lower absenteeism -- presenteeism improvement means employees who are physically present are performing more effectively rather than working at reduced capacity due to discomfort; the 19% absenteeism reduction translates directly to fewer lost workdays per employee annually, a recoverable payroll cost
- Activity-based zoning producing 15% to 25% lower voluntary attrition than sector peers -- organizations that provide the right mix of focus, collaborative, social, restorative, and learning spaces reduce the daily friction that accumulates into departure decisions; the 15% to 25% attrition reduction against sector peers represents a compounding competitive advantage in talent retention
- Team-based seating and collaboration-enabling layouts cutting time-to-hire by 20% to 30% -- the workplace itself functions as a talent attraction signal; organizations whose offices visibly support how people work attract candidates more effectively than those whose environments communicate friction and inflexibility; the 20% to 30% time-to-hire reduction represents a direct recruiting efficiency gain from workplace investment
- Focus room availability addressing the 30% to 50% demand gap over collaboration room availability in 2026 -- current booking data establishes that most offices have underinvested in focus space relative to actual employee demand under hybrid schedules; organizations that close this gap address the specific friction that makes remote work preferable for focused individual work, directly supporting return-to-office effectiveness
How should the ROI formula be applied to a real office investment decision and what data sources make the calculation defensible?
- The standard ROI formula applied to labor, space, and turnover rather than construction cost -- the ROI calculation becomes defensible when it connects to business data rather than design estimates; gains measured through payroll records for productivity, HR analytics for turnover, and booking system data for utilization can be verified independently by any leadership team member reviewing the case
- The 50-person, $100,000 salary, $500,000 lease model establishing financial scale -- with $5.5 million in combined annual labor and real estate exposure, even a 2% improvement in combined productivity and retention represents $110,000 in annual return; modeled against a $200,000 workplace investment, that return produces full payback within two years and positive return across a five-year horizon
- 10% contingency addition to investment estimates protecting the model from scope creep -- investment models that do not include contingency frequently understate the actual cost and overstate the ROI; adding 10% to 15% contingency to the investment side of the formula produces a more conservative and therefore more defensible calculation when leadership scrutinizes the numbers
- The Leesman Index as the standardized measurement framework that gives results comparative validity -- internally designed surveys produce results that cannot be compared to any external benchmark; the Leesman Index provides a globally standardized score that allows organizations to compare their workplace effectiveness rating to peer organizations and to measure their own improvement against a consistent instrument across multiple measurement periods
- Before measurements as the prerequisite for after measurements that mean anything -- post-occupancy survey results and utilization improvements are only interpretable against a documented baseline; organizations that begin investment projects without capturing before data cannot demonstrate improvement even when the improvement is real and significant; the baseline measurement is the first step of the ROI project, not an afterthought
- Three, six, and twelve month measurement intervals capturing the staged realization of different return types -- space utilization savings typically appear within six to nine months; productivity gains from ergonomic and acoustic improvements within nine to fifteen months; retention improvements within the first year as departure rates begin to reflect the improved environment; modeling these staged returns accurately requires measurement at each interval rather than a single post-occupancy review
How does retention economics specifically make the workplace design ROI case and why does the three-times retention finding matter for leadership?
- Employees in well-designed workplaces nearly three times more likely to stay establishing retention as the primary ROI driver -- at a replacement cost of 50% to 200% of annual salary, the three-times retention differential between well-designed and poorly-designed workplaces is not a wellbeing statistic; it is a direct financial multiplier on the cost of every departure the organization avoids
- 87% lower departure likelihood among highest-commitment employees connecting engagement to retention economics -- commitment is not an abstract cultural variable; it is a measurable predictor of departure behavior, and the 87% lower departure rate among highly committed employees establishes that investment in the conditions that drive commitment is investment in retention cost reduction
- 90% of employees who like their workspace expressing company pride versus 47% of those who feel disconnected -- this 43-point gap in organizational pride between engaged and disengaged workplace populations has direct implications for recruitment, referral quality, and the employer brand that attracts or repels talent; organizations competing for knowledge workers in the Greater Boston market pay a talent acquisition premium when their workplace communicates disconnection
- 93% of tech workers willing to stay longer for healthier workplace benefits establishing workplace quality as a retention contract term -- in talent markets where compensation parity is high, workplace quality functions as a non-compensation differentiator that influences stay decisions; organizations that provide ergonomic design, wellness spaces, and better environmental quality hold a retention advantage over those that compete on salary alone
- Eight-month new hire productivity ramp making each retention success worth more than its replacement cost avoidance -- the full value of retaining an experienced employee includes not only the avoided replacement cost but the preserved institutional knowledge, client relationship continuity, and team cohesion that no replacement hire delivers immediately; the financial model that captures only replacement cost understates the true retention ROI
- Attrition running 15% to 25% lower at organizations with activity-based space planning making layout a retention investment -- this specific outcome from space planning investment establishes that the design of the office floor plan -- not just furniture quality or acoustic treatment -- is a retention variable; organizations whose layouts provide the mix of space types that different work modes require retain people more effectively than those whose layouts create daily friction
How should Greater Boston organizations approach workplace investment practically and what role does Office Gallery play in the process?
- On-site assessment as the prerequisite for investment decisions that address actual rather than assumed friction -- the specific friction points that are costing a particular organization the most are not discoverable from generic workplace research; they require observation of how the actual space is used, conversation with the employees using it, and review of the utilization and HR data that reflects its performance consequences; Office Gallery's on-site assessment provides this diagnosis before any investment is specified
- WELL and LEED certification providing reportable compliance metrics alongside performance outcomes -- for Boston-area organizations with corporate sustainability reporting requirements or ESG commitments, WELL and LEED certification converts workplace investment into reportable metrics that satisfy governance and reporting obligations alongside the productivity and retention returns; the dual business case -- performance and compliance -- strengthens the leadership approval conversation
- Fire-resistant materials compliance as a cost-control and risk management dimension of the ROI model -- materials meeting California TB 117-2013 standards reduce ignition risk and the replacement cost associated with non-compliant materials in fire events; in the Greater Boston market where building codes and insurance requirements make compliant materials a specification standard, the cost of non-compliance is a risk variable that belongs in the investment model
- Ergonomic seating and height-adjustable workstations mapped directly to the 16% presenteeism and 19% absenteeism improvement -- these are the specific product categories whose documented performance outcomes provide the quantified return that the ROI model requires; Office Gallery specifies these products against the performance outcomes they deliver rather than against aesthetic or price-point criteria alone
- Acoustic solutions mapped to the up to two times focus time improvement and 25% distraction reduction -- acoustic treatment investment is justifiable in business terms through these specific documented returns; organizations that present acoustic investment to leadership as a comfort upgrade face a different approval conversation than those that present it as a focus time recovery initiative with a calculable productivity return
- Phased implementation allowing ROI demonstration before full investment commitment -- organizations uncertain about leadership approval for full workplace investment can implement the highest-return interventions first -- typically acoustic management and ergonomic workstation upgrades at the highest-occupancy positions -- demonstrate the measurable return at the three and six month marks, and use that evidence to justify the subsequent phases; Office Gallery's project management capability supports phased delivery as readily as full-project delivery; contact the team at 781-762-3733 or visit the showroom at 151 Carnegie Row in Norwood to begin the conversation