Ergonomics as a Business Strategy: The ROI Leaders Are Leaving on the Table
A single MSD claim costs $20,000 to $60,000. U.S. healthcare costs from poor ergonomics top $100 billion annually. Employees in poor setups lose 68 to 74 minutes weekly and output 15% less. Monitor arms pay back in under six months, sit-stand desks in six to twelve months. Ergonomics is a capital allocation decision — here is how to model it.
Post Summary
A single musculoskeletal disorder claim — back strain, carpal tunnel, repetitive stress injury — costs between $20,000 and $60,000 per incident including medical treatment, workers' compensation, lost productivity, replacement labor, and claims administration. U.S. healthcare costs linked to poor ergonomics top $100 billion per year. Employees in poorly configured workstations lose approximately 15% of their potential output compared with properly set up counterparts, and 51% of workers cite a poorly maintained workplace as a top cause of job dissatisfaction. The return on ergonomics appears across the P&L in claims, output, retention, and office utilization — which means ergonomic spending should be evaluated like any other capital purchase against cost, service life, risk reduction, and output impact.
Monitor arms and keyboard trays are typically the fastest to pay back — they are lower in cost, reduce upper-body, neck, eye, and wrist strain, and often recover their cost in under six months. Height-adjustable desks cost more upfront but tend to produce the biggest productivity lift, with payback typically falling between six and twelve months. Ergonomic chairs help reduce lower-back fatigue, support seated endurance, and lower MSD claims over a longer time frame. The purchase mix matters: if an organization invests primarily in chairs but skips monitor arms and keyboard trays, the ROI timeline extends unnecessarily because the fastest-payback items are absent. BIFMA-certified commercial furniture lasts five to ten years versus one to two years for non-certified alternatives, which changes the annualized cost comparison significantly.
The ROI model requires four inputs that most organizations already track: headcount, loaded labor cost, claim history, and upgrade cost. For productivity, the model applies the documented 15% output lift. For injury avoidance, a 30% claim reduction assumption against a $20,000 low-end avoided claim value produces a conservative annual savings estimate. Replacement cost savings are annualized based on the expected service life differential between commercial and non-commercial grade furniture — five to ten years versus one to two years. Subtracting upfront cost from annual savings produces a first-year net savings figure that finance can evaluate against other capital allocation decisions. Some insurance providers may also offer premium discounts of five to twelve percent for organizations achieving ergonomic certification standards, adding a direct operating cost reduction separate from productivity and claim savings.
The best ergonomic returns come from combining furniture upgrades with professional space assessments, employee training, and a planned rollout rather than from isolated purchases. New furniture by itself does not produce ROI — the return comes from the right product choice, the right layout, and consistent follow-through across every workspace. A practical rollout begins with a pilot of five to ten percent of staff for six to eight weeks, which surfaces fit issues and workflow friction before larger capital is committed and gives finance a small dataset grounded in the actual workplace rather than vendor projections. After pilot validation, the full rollout phases by department or floor, starting with the highest-impact areas first and tying each phase to clear outcomes including less disruption, faster adoption, and cleaner utilization data.
Employees who work through discomfort lose approximately 15% of their potential output — a loss that does not appear on any claim report but slips into missed deadlines, slower decision-making, and weaker work quality. Employees in poor setups also lose 68 to 74 minutes per week to workspace friction. The retention dimension adds a second layer: 51% of workers cite a poorly maintained workplace as a top cause of job dissatisfaction, and ergonomic neglect consistently increases voluntary turnover, which means more recruiting and training spend. The return-to-office dimension adds a third: when the office feels physically worse than a home setup, employees avoid it, and the organization pays rent on space that is not being used. Ergonomic neglect is not a one-time overhead item. It is a recurring P&L cost that compounds across claims, output, retention, and space utilization simultaneously.
Ergonomics is not a wellness extra. It is a money decision. If one workstation issue can lead to a $20,000 to $60,000 injury cost, and poor setups can drain 15% of output, then chairs, desks, monitor arms, and keyboard trays belong in budget talks.
Here’s the short version of how we see it:
- Bad ergonomics costs money through injury claims, missed work, lower output, turnover, and weak office use.
- Good ergonomics can pay back fast, with monitor arms and keyboard trays often paying back in under 6 months, and sit-stand desks in 6 to 12 months.
- Furniture life matters too: commercial-grade, certified products often last 5 to 10 years, while low-end options may need replacement in 1 to 2 years.
- The best returns come from a program, not random purchases: assess the space, test with a small pilot, train employees, then roll out in phases.
- Finance already has most of the data needed to model ROI: headcount, labor cost, claim history, and upgrade cost.
A few numbers stand out. Employees in poor setups can lose 68 to 74 minutes per week to workspace friction. And 89% of people who like their workplace also like their employer, versus 23% who do not. That makes ergonomics a labor, retention, and office-use issue - not just a safety one.
If we were explaining this article in one line, it would be this: ergonomic spending should be judged like any other asset purchase - by cost, service life, risk reduction, and output impact.
ERGO COACH 8 - The ROI of Ergonomics
The Hidden P&L Cost of Ergonomic Neglect
Poor ergonomics shows up across the P&L in ways that are easy to overlook. It hits claims, output, retention, and even office use. Because those costs are spread out, many teams miss the total drag.
Musculoskeletal Disorders and Days Away From Work
A single MSD claim - back strain, carpal tunnel, repetitive stress injury - costs a business between $20,000 and $60,000 per incident, including medical treatment, workers' compensation, lost productivity, replacement labor, and claims administration [1]. In the U.S., healthcare costs linked to poor ergonomics top $100 billion per year [2]. That isn't a one-off problem. It's a recurring business cost.
And the damage doesn't stop when someone stays on the job. Chronic discomfort chips away at focus, judgment, and day-to-day work. People dealing with physical pain aren't just absent more often - they're also less productive when they are at their desks [1].
Presenteeism, Turnover, and Weaker Office Utilization
For leaders, this is where the problem gets expensive in a quiet way. Employees who work through discomfort lose about 15% of their potential output compared with people in properly set up workstations [1]. You won't spot that loss on a claim report. It slips into missed deadlines, slower calls, and weaker work.
There's also a people cost. 51% of workers cite a poorly maintained workplace as a top cause of job dissatisfaction [3]. Put plainly, ergonomic neglect can push people out the door, which means more hiring and training spend.
For companies pushing return-to-office, the math is simple: if the office feels worse than home, employees avoid it, and the space gets used less. That's money spent on a workplace people don't want to use.
That is why the return on ergonomics depends on full programs, not isolated purchases.
Where Ergonomic Investments Produce Measurable Returns
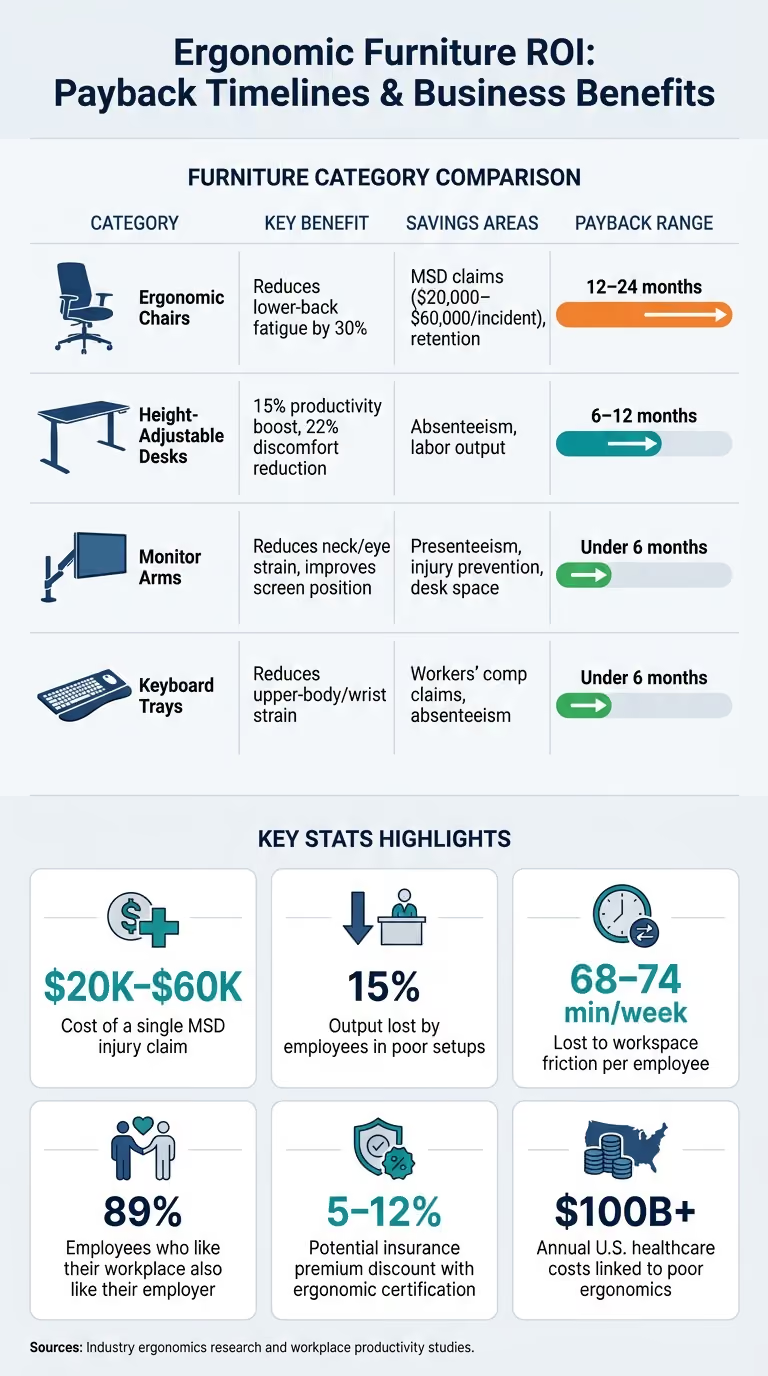
Ergonomic programs pay back in places leaders already track: fewer claims, lower absenteeism, and better output. That’s where the money comes back. When a program is done well, it lowers MSD rates, cuts missed workdays, and helps teams get more done. For example, ergonomic furniture reduces physical discomfort by 22% and increases productivity by 15% [1].
Why Full Programs Outperform One-Off Purchases
The best returns usually don’t come from buying a few chairs and calling it done. They come from combining furniture upgrades with professional space assessments, employee training, and a planned rollout.
A smart way to start is with a pilot with 5–10% of your staff for 6–8 weeks before rolling anything out across the whole company [1]. That gives you time to spot fit issues and workflow friction early, before you commit a large amount of capital. It also gives finance something better than guesswork: a small but useful dataset tied to your own workplace.
There’s also a cost angle beyond claims and output. Some insurance providers may offer premium discounts of 5–12% for organizations that achieve ergonomic certification standards [2]. That’s a direct cut in operating cost, separate from any lift in productivity or drop in claims.
How Each Furniture Category Affects Financial Outcomes
Not every ergonomic purchase pays back on the same schedule. Some items are lower-cost and start working fast. Others take longer but affect bigger parts of the workday.
Monitor arms and keyboard trays are usually the fastest to pay back. They cost less, reduce upper-body, neck, eye, and wrist strain, and often recover their cost in under six months [1]. Height-adjustable desks cost more up front, but they tend to produce the biggest productivity lift, with payback usually falling between six and twelve months [1]. Ergonomic chairs help reduce lower-back fatigue, support seated endurance, and lower MSD claims over a longer time frame.
That difference matters. If your purchase mix is off, the ROI timeline changes with it.
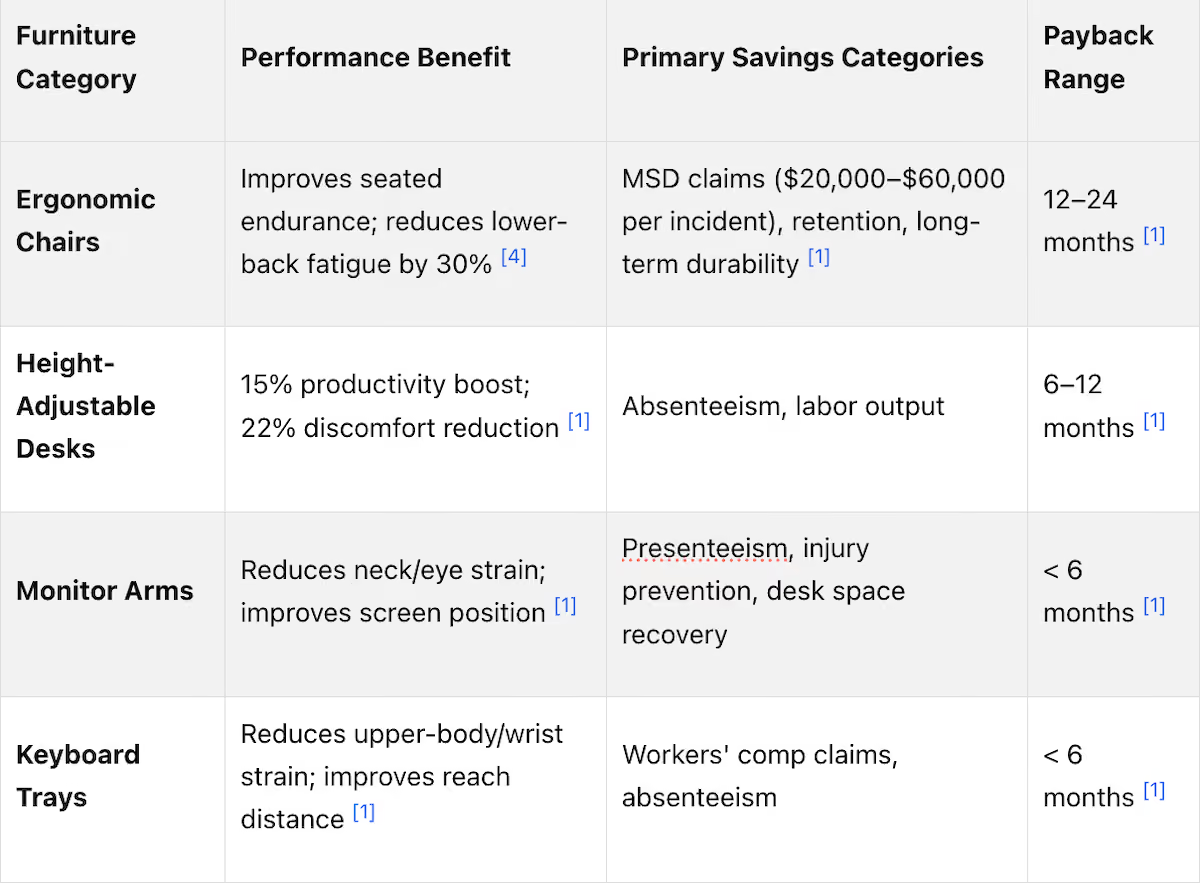
Discomfort chips away at focus and slows decision-making [1]. The right furniture mix helps stop that drain, which makes ergonomic spending less like a perk and more like protecting the output your labor budget already pays for.
The next step is translating these category-level returns into a site-specific ROI model.
How to Model Ergonomics ROI for a Boston-Area Workplace
Use the payback ranges above to test ergonomics against your own labor cost, claims history, and turnover rate. You don’t need to build a fancy model from scratch. Start with the HR, finance, and operations data your team already tracks.
The main idea is simple: treat ergonomic upgrades like capital investments. Then measure them against the costs that hit the business every year, such as labor, claims, downtime, and replacement cycles.
The Data Finance and Operations Already Have
You can model productivity, claim reduction, and replacement savings with four inputs you likely already have:
- Headcount
- Loaded labor cost
- Claim history
- Upgrade cost
For productivity, use the 15% output lift in your model. For injury avoidance, use a 30% claim-reduction assumption and a $20,000 low-end avoided-claim value. Then annualize replacement cost based on expected service life.
That gives you a model grounded in your own numbers, not guesswork.
A Hypothetical Mid-Size Office Scenario
With a model built, you can then turn the inputs into a simple first-year savings model:
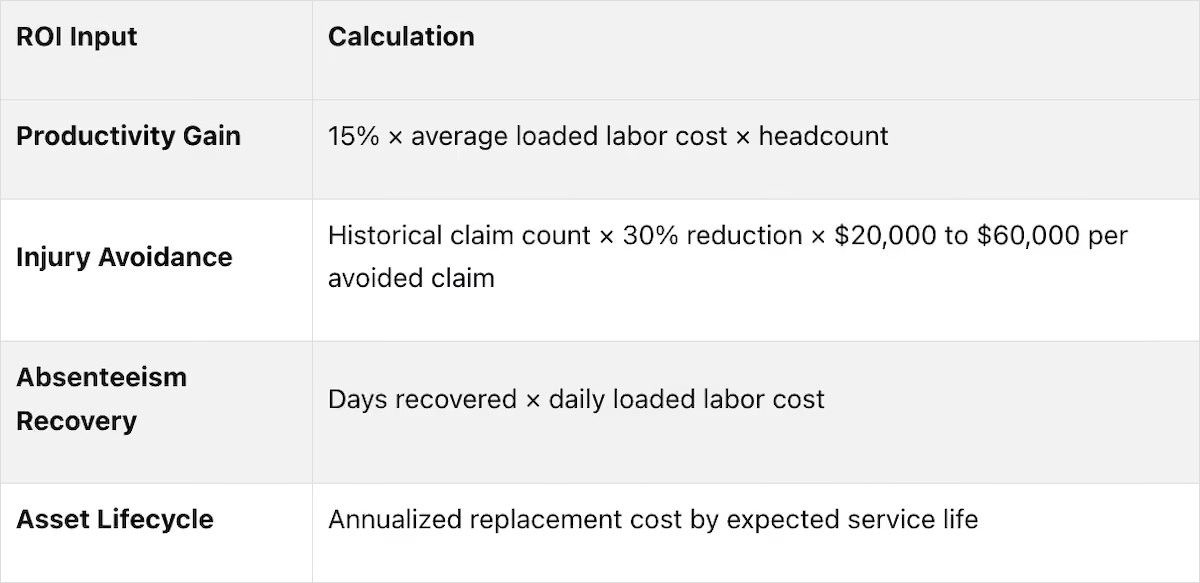
Subtract upfront cost from annual savings to give finance a first-year net savings estimate.
For local rollout planning, on-site reviews can confirm ADA- and OSHA-aligned placement before rollout.[1][2]
Turning Ergonomics ROI Into a Measurable Workplace Program
The math only holds up when the rollout matches the plan. New furniture, by itself, doesn't produce ROI. You get the return from the right product choice, the right layout, and steady follow-through across each workspace in the building.
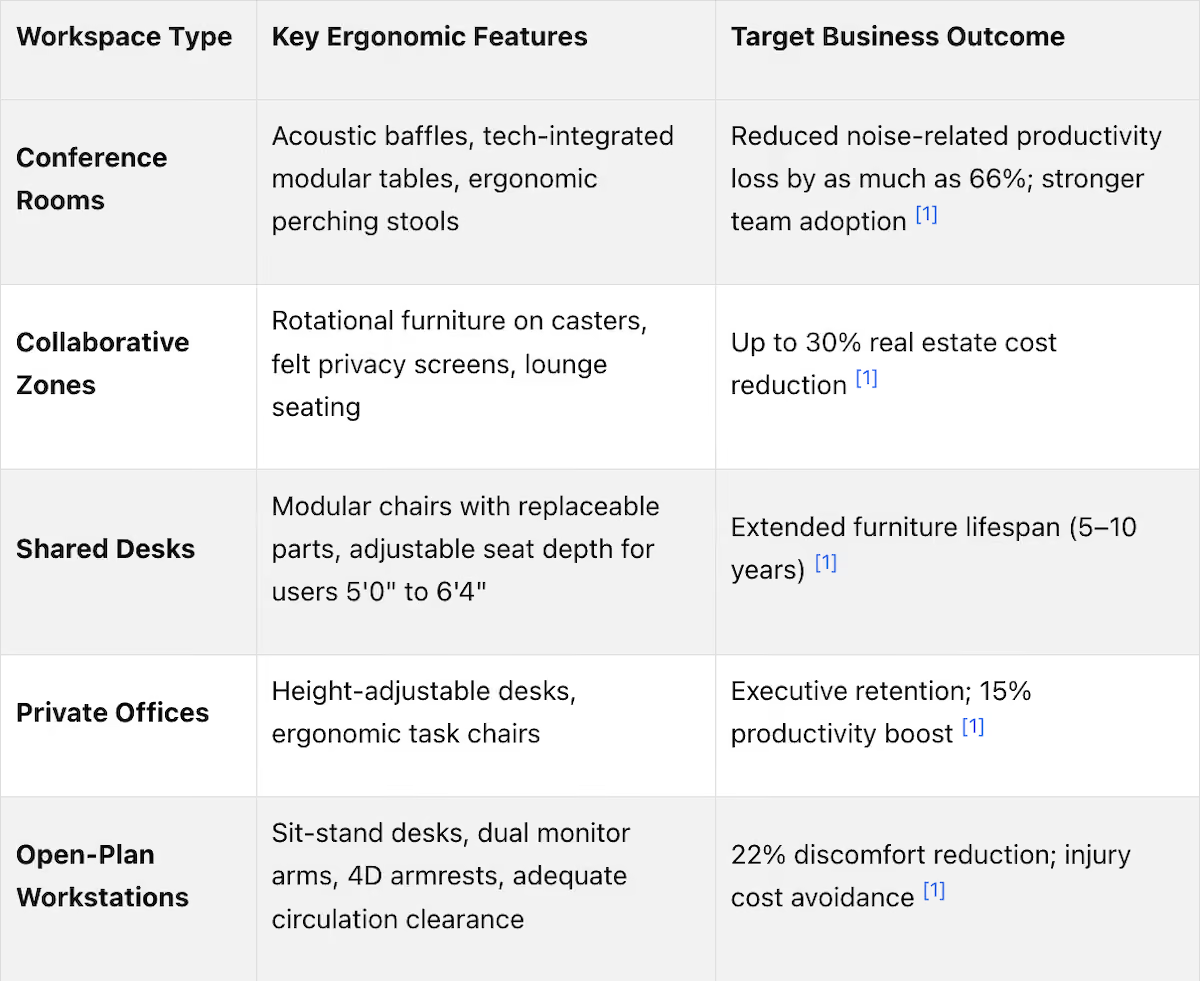
Ergonomic Design Standards Across Different Workspace Types
Set standards for clearance, adjustability, and durability that work for most people and hold up over time. The point isn't to overload every room with top-tier specs. It's to match each space to the way it pays back its cost.
How to Roll Out Furniture Upgrades Without Disrupting Operations
Specs on paper don't mean much if the install throws off day-to-day work. In most cases, the biggest risk isn't cost. It's timing and coordination. If furniture shows up in the wrong order, or installers haven't mapped power outlets and network ports, the project starts creating the same friction it was supposed to fix. That's usually when leadership starts losing trust.
A practical rollout begins with a review of current workstation conditions, then moves to the highest-impact areas first, gathers employee feedback, and phases the full rollout by department or floor [1]. Those consultations should also measure dynamic zones and circulation streets so the layout works after installation, not just in a floor plan [1]. When each phase is tied to clear outcomes - less disruption, faster adoption, cleaner data, and stronger executive buy-in - the program stays grounded in results instead of guesswork.
Conclusion: The ROI Most Leaders Still Underestimate
When the program is installed the right way, the return shows up in space use, output, and fewer avoidable costs. Ergonomic neglect isn't some minor overhead item. It keeps hitting the P&L again and again. The leaders who fix this are the ones who stop treating ergonomics like a facilities purchase and start treating it like a repeatable capital allocation decision - one that keeps paying back across every workstation, every lease cycle, and every new hire. The same footprint can deliver more when it's built for steady performance.
FAQs
How do we calculate ergonomics ROI?
Calculate ergonomics ROI the same way you’d judge any capital purchase: weigh the cost of the investment against direct savings, indirect gains, and productivity improvements.
Start with the clearest numbers. Prevented MSD claims alone can have a big financial effect, with each avoided case saving $20,000 to $60,000. Then look at day-to-day performance. Height-adjustable workstations can drive 15% output gains, while better ergonomic setups can cut discomfort by 22%. Those changes don’t just help people feel better at work - they can also lead to fewer mistakes, steadier output, and less lost time.
There are also labor-related savings that often get missed in a first pass. Lower absenteeism means fewer gaps in coverage and less drag on team performance. Lower turnover can reduce hiring and training costs, which add up fast when roles are hard to fill or ramp time is long.
Furniture life span matters too. BIFMA-certified furniture often lasts 5 to 10 years, compared with just 1 to 2 years for non-certified options. So even if the upfront price is higher, the cost per year of use can be much lower.
A simple ROI view can include:
- Direct savings: prevented MSD claims, lower absenteeism, and reduced replacement costs
- Indirect gains: lower turnover, less discomfort, and smoother day-to-day work
- Productivity impact: output gains from height-adjustable workstations and fewer disruptions
Put all of that together, and ergonomics looks less like an office perk and more like a business investment with measurable returns.
Which ergonomic upgrades pay back fastest?
Height-adjustable workstations and well-chosen ergonomic furniture usually deliver the fastest payback. They’re tied to lower discomfort by about 22%, fewer injury claims by about 30%, and productivity gains of about 15%.
For capital allocation, start with height-adjustable desks, core seating, and fitting changes that make workstations actually adjustable. That matters more than it sounds. If a desk or chair can’t be set up to fit the person using it, the upgrade often falls flat.
There’s also a simple cost angle here: avoiding just one claim can save about $20,000 to $60,000.
How should we phase an ergonomics rollout?
Start with a pilot program that includes 5–10% of staff for 6–8 weeks. That gives you room to test furniture and workstation setups in your actual workspace, not in a showroom or a spec sheet. You can gather feedback, spot comfort problems, and catch workflow issues before you commit more money.
After that, bring in expert consultations to fine-tune the setup. Focus on things like modularity, cable management, and storage needs. This can lower specification risk, help you choose options that hold up over time, and confirm ROI through better productivity and fewer injury claims.
•••••
If your office is ready for a similar transformation, whether you're in the Greater Boston area or farther out in New England, we'd love to talk. Visit our showroom at 151 Carnegie Row in Norwood, or call us at 781-762-3733 to schedule a consultation.
Key Points
What is the full P&L cost of ergonomic neglect and why do most organizations underestimate it?
- $20,000 to $60,000 per MSD claim making injury avoidance the most financially significant ergonomic return -- at this cost per incident, an organization experiencing even three MSD claims annually is absorbing $60,000 to $180,000 in direct and indirect costs that a properly specified ergonomic program would reduce by approximately 30%; the prevention value substantially exceeds the investment in most workplace scenarios
- $100 billion in annual U.S. healthcare costs from poor ergonomics establishing the scale of the systemic problem -- this figure establishes that MSD claims and ergonomic-related health costs are not edge cases or outlier events; they represent a consistent, predictable cost category that organizations can reduce through investment rather than absorb as an unavoidable overhead
- 15% output reduction in poorly configured workstations as the presenteeism cost that never appears on a claim report -- the productivity loss from employees working through discomfort is invisible in claims data, attendance records, and most performance metrics; it shows up in the aggregate as slower work, missed deadlines, and weaker decisions without being traceable to a specific cause without workstation assessment data
- 68 to 74 minutes per week lost to workspace friction per employee -- at this rate, a 50-person organization is losing the equivalent of approximately 57 to 62 hours of productive work weekly from workspace friction alone; annualized, that is a significant recoverable labor cost that proper ergonomic configuration addresses directly
- 51% of workers citing poorly maintained workplace as a top cause of job dissatisfaction connecting ergonomics to retention -- when more than half the workforce identifies poor workplace conditions as a dissatisfaction driver, ergonomic neglect is a measurable retention risk; the hiring and training cost of replacing employees who leave partly due to poor physical work conditions compounds the direct P&L cost of the neglect
- The distributed nature of ergonomic cost creating the blind spot that allows it to persist -- claims hit one budget line, presenteeism affects output without attribution, turnover costs hit HR budgets, and underutilized space affects real estate costs; because the total cost of ergonomic neglect is distributed across multiple P&L categories, no single budget owner sees the full picture, which is why the aggregate cost is consistently underestimated
How do the payback timelines for different ergonomic furniture categories inform capital allocation decisions?
- Monitor arms and keyboard trays as the fastest-payback ergonomic investment category -- these lower-cost items address the upper-body, neck, eye, and wrist strain that accumulates from fixed monitor positions and keyboard surfaces at incorrect heights; their under-six-month payback makes them the highest-priority first investment for organizations with limited upgrade budgets or those beginning a phased program
- Height-adjustable desks as the highest total-productivity-return investment despite the longer payback window -- the six to twelve month payback on sit-stand desks reflects a higher upfront cost rather than a lower return; the 15% productivity lift that height-adjustable workstations produce is among the most well-documented ergonomic outcomes in the research literature, making them the highest-value single category investment for most organizations
- Ergonomic chairs improving seated endurance and reducing MSD claims over a longer time frame -- chairs have the longest payback timeline of the three primary categories because their most significant financial return is injury prevention rather than immediate productivity improvement; the $20,000 to $60,000 per avoided MSD claim makes chair investment highly financially attractive over a three to five year model horizon even when the short-term productivity return is modest
- BIFMA certification as the durability signal that changes the annualized cost comparison -- at five to ten years of service life versus one to two years for non-certified alternatives, BIFMA-certified furniture produces a cost-per-year-of-use that consistently favors the higher-quality option when modeled over the full product lifecycle; organizations that purchase non-certified furniture to reduce upfront cost are typically paying more in total over five years
- Purchase mix determining the aggregate ROI timeline -- an organization that invests only in chairs misses the fastest-payback items and extends its overall ROI timeline unnecessarily; the optimal first-phase purchase mix for most organizations combines monitor arms and keyboard trays for immediate payback with height-adjustable desks for the primary productivity lift
- Insurance premium discounts of five to twelve percent for ergonomic certification adding a direct operating cost reduction -- this return is independent of productivity gains and claim reductions; for organizations with significant workers' compensation premium exposure, achieving ergonomic certification standards produces a measurable annual operating cost saving that adds to the investment model without requiring any additional occupancy change
How should the ergonomics ROI model be constructed to make the capital investment case to finance and leadership?
- Four inputs that most organizations already track eliminating the data collection barrier -- headcount, loaded labor cost, claim history, and upgrade cost are standard financial and HR data points that most organizations maintain; the ergonomics ROI model does not require new measurement infrastructure, only the application of documented performance parameters to existing data
- 15% productivity lift applied to loaded labor cost as the primary return driver in most models -- at average knowledge worker salaries, a 15% output improvement across a 50-person team represents a significant annual productivity gain that typically exceeds the cost of the ergonomic upgrade in the first year; this is the single most financially compelling number in the ergonomics ROI model for most organizations
- 30% claim reduction assumption against $20,000 low-end avoided claim value as the conservative injury avoidance estimate -- using the low end of the $20,000 to $60,000 claim cost range with a 30% reduction assumption produces a defensible conservative estimate that finance can stress-test; organizations with higher historical claim rates or higher-severity claim profiles produce proportionally larger injury avoidance returns
- Annualized replacement cost based on service life differential strengthening the multi-year model -- the difference between one to two year and five to ten year furniture service life produces a replacement cost avoidance that compounds over the investment horizon; at five years, an organization replacing non-certified furniture twice is paying two purchase prices plus two installation costs against one commercial-grade purchase with one installation cost
- First-year net savings as the entry-level model that frames ergonomic investment in capital allocation language -- subtracting total upgrade cost from total annual savings produces the number that finance can evaluate against other capital decisions; framing ergonomic spending as a capital allocation with a first-year net savings figure rather than as an expense with a comfort benefit changes how the investment is categorized and approved
- Pilot dataset replacing projections with real-world validation before full commitment -- the six to eight week pilot with five to ten percent of staff produces actual performance data from the specific workplace rather than industry averages; a pilot-validated model that shows actual productivity improvement and comfort score changes in the organization's own environment is materially more persuasive to finance than a projection based on published research alone
What implementation failures undermine ergonomic program ROI and how does proper rollout prevent them?
- New furniture without professional assessment falling flat -- ergonomic furniture that is delivered and self-assembled without workstation assessment frequently ends up configured incorrectly for the occupant; a chair adjusted to the wrong seat height, a monitor arm set to the wrong angle, or a keyboard tray at the wrong depth can produce ergonomic outcomes no better than the equipment being replaced, eliminating the return while incurring the cost
- Installation sequencing failures creating the friction the upgrade was supposed to eliminate -- when furniture arrives in the wrong order, or installers have not mapped power outlets and network ports before installation day, the project creates operational disruption that erodes leadership confidence and employee adoption; the rollout plan must address sequencing and coordination before product delivery begins
- Skipping the pilot phase losing the data validation that makes the full rollout defensible -- organizations that skip the five to ten percent pilot and roll out across the full workplace have no real-world performance data to validate the investment; when the full rollout produces unexpected results — products that do not fit certain workstation types, employee feedback about configurations that do not work — there is no pilot data to inform correction
- Training gap eliminating the behavior change that converts furniture into ergonomic performance -- ergonomic furniture that employees do not know how to adjust correctly provides no more ergonomic benefit than fixed furniture; the adjustment training investment of fifteen to thirty minutes per employee at rollout is what converts the furniture purchase into a functional ergonomic intervention
- Phasing by department or floor with clear per-phase outcomes connecting rollout to measurable progress -- a phased rollout without defined outcomes for each phase produces a rollout that continues indefinitely without demonstrating results; connecting each phase to specific metrics — reduced discomfort scores in the surveyed area, faster employee adoption, lower friction complaints — creates the accountability structure that maintains leadership support through the full program
- Post-rollout measurement confirming that the ROI model held up in practice -- organizations that implement ergonomic programs without post-rollout measurement cannot confirm the return or demonstrate it to finance for future investment justification; tracking discomfort scores, claim rates, and utilization data at three, six, and twelve months post-rollout produces the evidence that validates the initial investment and justifies the next phase
How does ergonomic investment specifically address the return-to-office and hybrid attendance problem?
- The office feeling physically worse than home as the ergonomic dimension of the return-to-office challenge -- most home offices assembled during the pandemic include at minimum a chair, a desk, and a monitor that the individual has adjusted to their preferences over years of daily use; a corporate office with non-adjustable chairs, fixed-height desks, and monitors on fixed stands is physically worse than that home setup for many employees
- Ergonomic parity with home setup as the baseline that makes the commute worth the physical trade-off -- employees making a daily commute to an office that is less comfortable and less productive than their home setup are making a net-negative physical trade-off for the in-office days; ergonomic investment that brings the office to or above home setup quality removes the physical argument for working from home
- 68 to 74 minutes of workspace friction per week accumulating into an argument for staying home -- for employees who experience this friction in the office but not at home, the weekly productivity differential provides a rational, experience-based argument for remote work that no return-to-office policy directly addresses; ergonomic investment addresses the experience gap that policy cannot close
- Office utilization cost compounding ergonomic neglect -- when the office is avoided due to physical discomfort, the organization pays rent on space that is not being used while simultaneously absorbing the productivity loss of employees working in less collaborative home environments; ergonomic investment addresses both costs simultaneously by making the office worth using
- Post-ergonomic investment office utilization improvement as a measurable return on the upgrade -- organizations that track office utilization before and after ergonomic upgrades can quantify the utilization return as part of the investment model; if utilization increases by 10% after ergonomic improvements, the cost-per-occupied-workstation decreases proportionally, reducing the effective real estate cost per unit of productive work
- The physical environment as the controllable dimension of the return-to-office equation -- compensation, management quality, and commute length are partially or fully outside organizational control as return-to-office levers; the physical quality of the office is entirely within organizational control; ergonomic investment is the most direct and fastest-acting lever available to make the in-office experience worth choosing
How does Office Gallery translate ergonomic investment principles into practical workplace programs for their client's organizations?
- On-site workstation assessment as the prerequisite that grounds product specification in actual conditions -- the most common ergonomic investment failure is specifying products without assessing the workstations they will occupy; seat height ranges that do not accommodate the actual height distribution of the workforce, monitor arm specifications that do not fit the desk edge profiles in the space, and keyboard tray depths that conflict with desk construction are all correctable through pre-specification assessment and avoidable through it
- ADA and OSHA-aligned placement confirmation before rollout protecting compliance and preventing post-installation correction -- ergonomic workstation placement that does not meet ADA clearance requirements or OSHA recommended positioning guidelines creates compliance exposure alongside the performance gap; confirming placement before installation is a lower cost than correcting it after
- Dynamic zone and circulation measurement ensuring the layout works after installation -- the floor plan that looks functional in two dimensions can produce circulation bottlenecks, inaccessible workstations, and inadequate clearance around height-adjustable desks in motion when measured in the actual space; Office Gallery's pre-installation space assessment addresses these dimensional issues before product arrives
- Phased implementation matching upgrade investment to budget cycles -- not every organization can complete a full ergonomic upgrade in a single budget cycle; Office Gallery supports phased programs that prioritize the fastest-payback categories in year one, expand to higher-cost categories in subsequent cycles, and use the performance data from each phase to justify the next investment
- Commercial-grade product specification preventing the replacement cycle that eliminates total cost of ownership advantage -- the total cost of ownership argument for BIFMA-certified commercial furniture over non-certified alternatives only holds when the specification actually delivers certified commercial-grade product; Office Gallery's manufacturer relationships and specification expertise ensure the product delivered matches the performance standard the ROI model assumed
- Contact Office Gallery at 781-762-3733 or visit the showroom at 151 Carnegie Row in Norwood -- serving the corporate sphere since 1989, Office Gallery provides the workstation assessment, product specification, phased implementation planning, and installation management that converts ergonomic investment from a one-off purchase into a measurable program with documented returns; the conversation starts with the specific workplace conditions affecting your organization's output, claims, and retention today